Steem Total Value Powered Up - $39 million - May 29, 2022
11 comments
This is next in my series of posts reviewing the amount and value of powered up STEEM on the Steem blockchain. For previous posts, see the end of this entry.
Noteworthy in the last week,
- Week over week, the number of powered up STEEM grew by about 200K, or just over 0%.
- The week saw 5 daily increases and 1 new high (today) in number of STEEM powered up.
- At 41.61%, the series-long high as a percentage of market cap was recorded on April 26. Nearly all subsequent observations have been in the 39% range, so this was probably a fluke of timing in the way that CoinGecko updates their market cap and price fields.
- The modeled value of powered-up STEEM lost ground against all comparison tokens. Changes ranged from -4.6% against ETH and LTC to -20% against TRX.
- The modeled value of powered-up STEEM lost ground against the USD by about 15%.
- Total power-downs this week totaled 880K STEEM, which roughly doubled last week's 440K.
- In terms of all comparison values except for TRX and USD, today's locked value is still higher than the January 1, 2022 baseline.
Here are the numbers as-of a few minutes ago:
Total value locked in powered-up STEEM (USD): $39,096,144.36
STEEM market cap $97,966,277.67
Locked value in terms of other tokens:
| token | price | locked value equivalent | Jan 1, 2022 | pct of Jan 1 baseline |
|---|---|---|---|---|
| tron | $0.08 | 485,883,679 | 809,173,538 | 60.05% |
| steem-dollars | $2.56 | 15,271,931 | 11,284,131 | 135.34% |
| bitcoin | $29,281.00 | 1,335 | 1,300 | 102.73% |
| ethereum | $1,805.72 | 21,651 | 16,501 | 131.21% |
| litecoin | $63.15 | 619,099 | 411,561 | 150.43% |
| steem | $0.25 | 157,554,895 | 142,930,214 | 110.23% |
| USD | $1.00 | 39,096,144 | 61,837,042 | 63.22% |
And here are the charts, based on data collected daily since April 10, 2021.
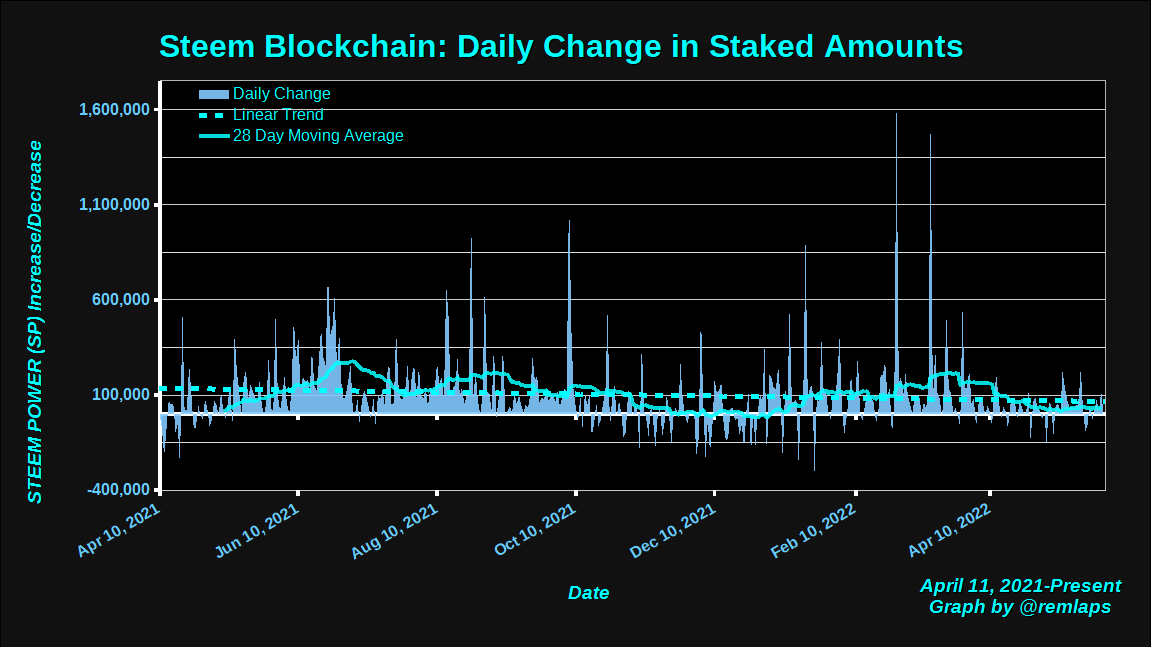
Daily Changes
Here is a chart of daily changes in powered-up STEEM from April 11, 2021 to present. The graph also includes a linear trend line and a 28 day moving average.
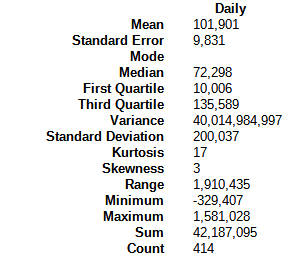
Here are some descriptive statistics, for numbers geeks.
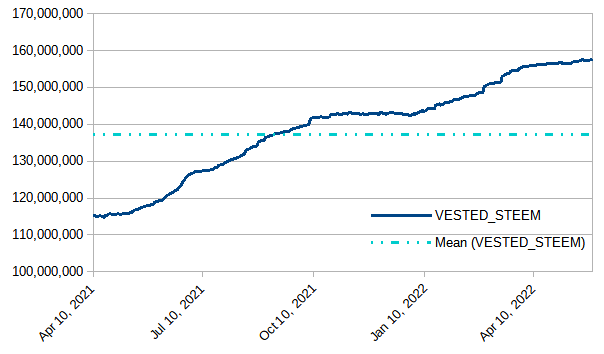
VESTED STEEM
With a weekly gain of about 200k, the graph has a barely perceptible upward slope in recent weeks.
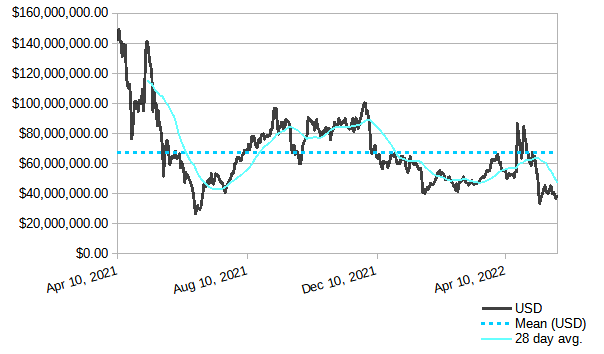
Modeled value of powered-up STEEM in terms of USD
In terms of USD, we saw a weekly decrease of about 6 1/2 million dollars, or 14 1/2%. With today's download at $39 million, the value is still a touch above its May 12 bottom near $34 million, and it remains above the lows from June, 2021.
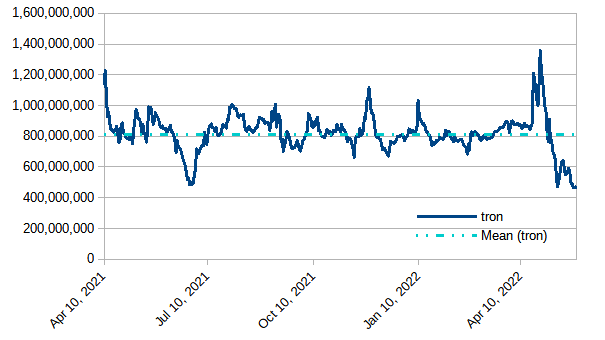
Modeled value of powered-up STEEM in terms of Tron (TRX)
TRX has shown continuing strength in a mostly down market, and gained additional ground against powered-up STEEM by about 115 million tokens or 20%. This staying power may make the Steem ecosystem more attractive to some because the Steem blockchain provides a mechanism for people to get TRX tokens by blogging and curating Steem's social media content. The historic ratio of STEEM:TRX prices was around 5:1, but recently it's running at 3:1, so using STEEM to acquire TRX is now cheaper than ever.
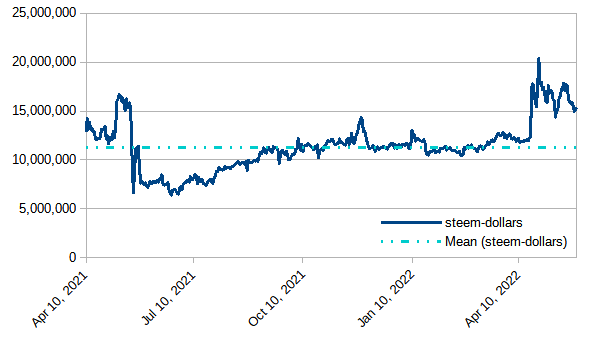
Modeled value of powered-up STEEM in terms of Steem Dollars
Down by about 800K or just over 5%
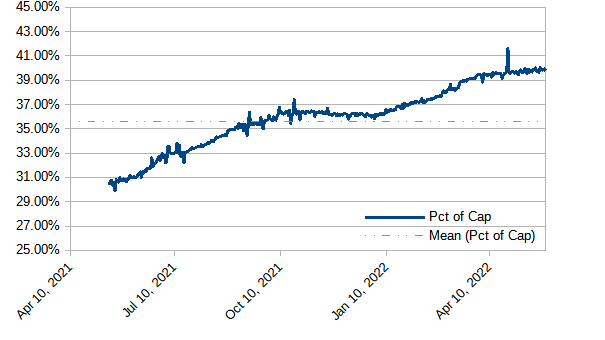
Modeled value of powered-up STEEM as a percentage of Steem's market cap
Running basically flat for the last seven or eight weeks, with an anomalous spike on April 26. With today's observed value of 39.99%, we have now seen 55 consecutive days above 39%; 88 consecutive days above 38%; 119 consecutive days above 37%; 246 consecutive days above 35%; and 309 straight days above 1/3. After three months of upslope, the graph seems to have leveled off near the boundary between 39% and 40%. Will it hold above 39%? Will it go above 40%?
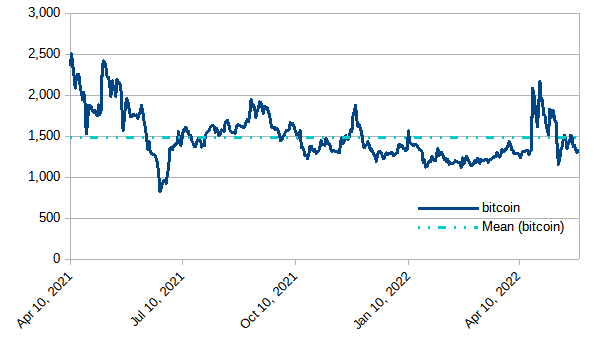
Modeled value of powered-up STEEM in terms of bitcoin (BTC)
Down by about 190 BTC, or 12 1/2% during the week.
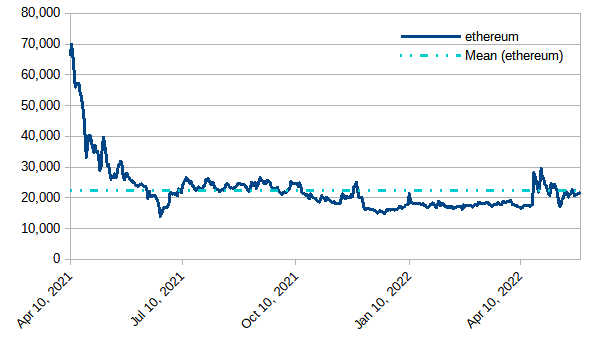
Modeled value of powered-up STEEM in terms of Ethereum
Down by about 1,000 ETH, or a bit over 4 1/2%.
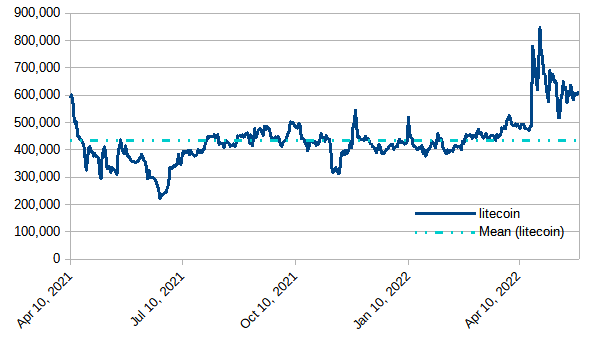
Modeled value of powered-up STEEM in terms of Litecoin
Powered-up STEEM moved down by about 30,000 LTC, or just over 4 1/2%. Still running above the historical average.
Daily Powerdown Activity
Here is graph with data from steemdb.io to show daily completed and pending powerdown activity. Overall, with about 880K powered down last week and 745K pending, we can expect weekly powerdowns to decrease by about 15% or more.
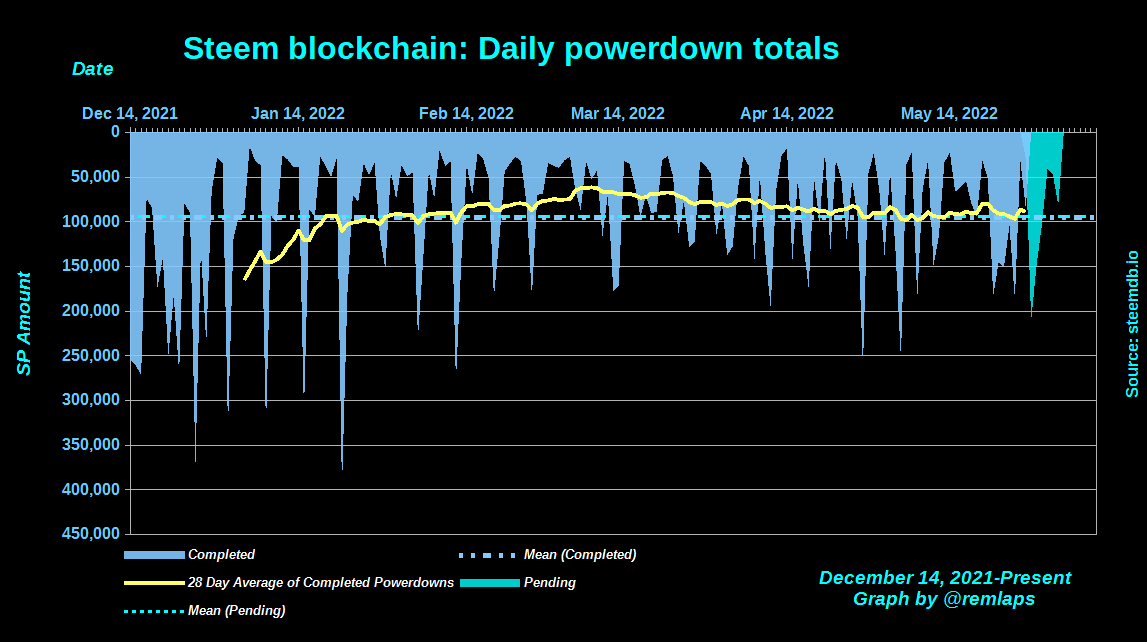
The horizontal lines are the average values for completed (blue) and pending (cyan) powerdowns, and the yellow line is a 28 day moving average of completed powerdowns.
Here are some descriptive statistics for the numbers geeks:
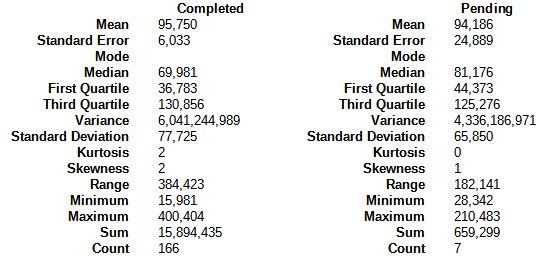
And with a total of 1,133 pending power downs, here are the times, dates, and amounts of the top-10:
 1  2022-05-30T07:20:27 - 136,688,234 MVESTS, 75,240 STEEM
 2  2022-06-05T07:41:24 - 134,732,066 MVESTS, 74,164 STEEM
 3  2022-05-31T04:54:48 - 118,241,014 MVESTS, 65,086 STEEM
 4  2022-05-30T13:19:12 - 67,147,363 MVESTS, 36,961 STEEM
 5  2022-05-31T20:05:48 - 59,704,048 MVESTS, 32,864 STEEM
 6  2022-06-05T16:03:15 - 54,026,987 MVESTS, 29,739 STEEM
 7  2022-06-04T10:50:00 - 46,989,566 MVESTS, 25,865 STEEM
 8  2022-06-01T13:30:54 - 39,933,778 MVESTS, 21,982 STEEM
 9  2022-05-30T13:13:15 - 38,397,977 MVESTS, 21,136 STEEM
10  2022-06-05T18:00:09 - 36,736,453 MVESTS, 20,222 STEEM
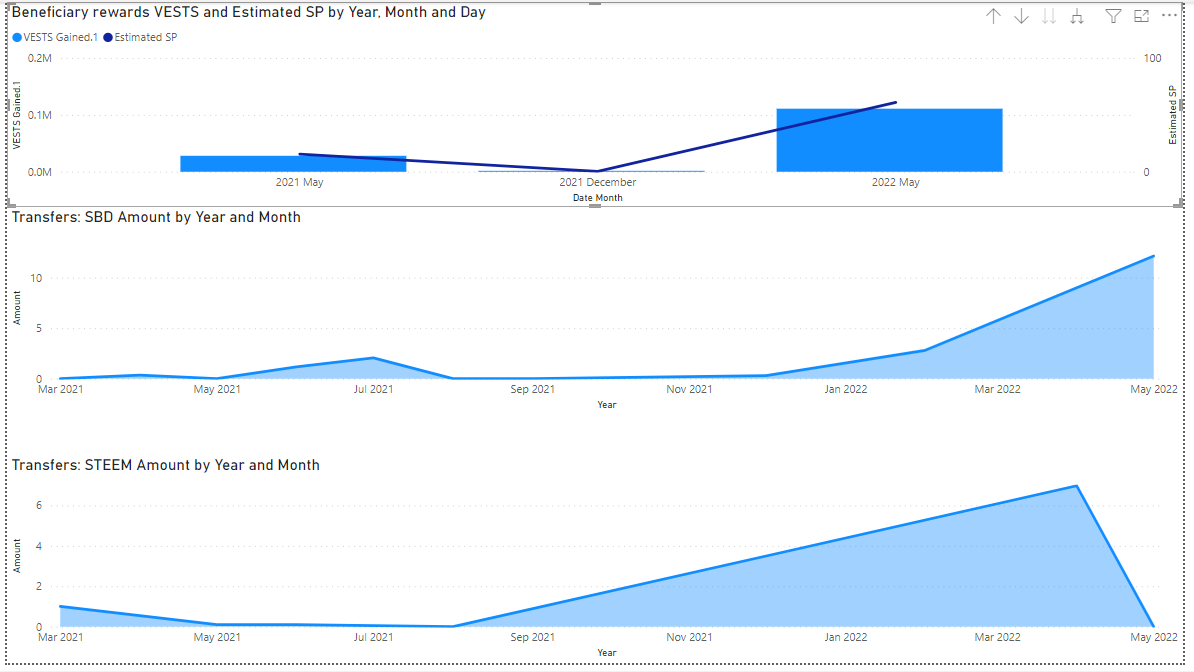
Side note: In case anyone is interested, here's a graph summarizing all of the @null burn activity that's recorded in steemdb.io through today. At this moment, the estimated total SP burned in May (top graph) is estimated at 61 SP. The corresponding STEEM and/or SBD in beneficiary rewards are not shown here, but the overall value would be doubled (assuming a value of 1 USD per SBD).
Notes
- Reference prices for STEEM and other tokens are downloaded from coingecko.com
Previous posts
- Steem Total Value Powered Up - $67 million - January 2,
20212022 - Steem Total Value Powered Up - $57 million - January 9, 2022
- Steem Total Value Powered Up - $60 million - January 16, 2022
- Steem Total Value Powered Up - $43 million - January 23, 2022
- Steem Total Value Powered Up - $46 million - January 30, 2022
- Steem Total Value Powered Up - $54 million - February 6, 2022
- Steem Total Value Powered Up - $50 million - February 13, 2022
- Steem Total Value Powered Up - $46 million - February 20, 2022
- Steem Total Value Powered Up - $48 million - February 27, 2022
- Steem Total Value Powered Up - $47 million - March 6, 2022
- Steem Total Value Powered Up - $47 million - March 13, 2022
- Steem Total Value Powered Up - $51 million - March 20, 2022
- Steem Total Value Powered Up - $60 million - March 27, 2022
- Steem Total Value Powered Up - $65 million - April 3, 2022
- Steem Total Value Powered Up - $55 million - April 10, 2022
- Steem Total Value Powered Up - $68 million - April 24, 2022
- Steem Total Value Powered Up - $67 million - May 1, 2022
- Steem Total Value Powered Up - $62 million - May 8, 2022
- Steem Total Value Powered Up - $42 million - May 15, 2022
- Steem Total Value Powered Up - $45 million - May 22, 2022
- Steem Total Value Powered Up - $39 million - May 29, 2022
Comments