Steem Total Value Powered Up - $42 million - May 15, 2022
9 comments
This is next in my series of posts reviewing the amount and value of powered up STEEM on the Steem blockchain. For previous posts, see the end of this entry.
Noteworthy in the last week,
- Week over week, the number of powered up STEEM grew by about 600K, or just about 2/5%.
- The week saw 6 daily increases and 4 new highs in number of STEEM powered up. The new highs are now on a 4 day streak.
- At 41.61%, the series-long high as a percentage of market cap was recorded on April 26. All subsequent observations have been in the 39% range, so this was probably a fluke of timing in the way that CoinGecko updates their market cap and price fields.
- The modeled value of powered-up STEEM lost ground against all comparison tokens. Changes ranged from -3% against SBD to -24% against BTC.
- In a week of turmoil for the entire crypto space, the modeled value of powered-up STEEM lost ground against the USD by about 33%.
- Total power-downs this week totaled 604K STEEM, down by about 12% from last week's 690K.
- In terms of all comparison values except for TRX and USD, today's locked value is still higher than the January 1, 2022 baseline.
Here are the numbers as-of a few minutes ago:
Total value locked in powered-up STEEM (USD): $41,895,905.13
STEEM market cap $105,249,786.96
Locked value in terms of other tokens:
| token | price | locked value equivalent | Jan 1, 2022 | pct of Jan 1 baseline |
|---|---|---|---|---|
| tron | $0.07 | 594,217,586 | 809,173,538 | 73.44% |
| steem-dollars | $2.54 | 16,494,450 | 11,284,131 | 146.17% |
| bitcoin | $30,431.00 | 1,376 | 1,300 | 105.89% |
| ethereum | $2,095.65 | 19,991 | 16,501 | 121.15% |
| litecoin | $69.42 | 603,513 | 411,561 | 146.64% |
| steem | $0.27 | 157,047,022 | 142,930,214 | 109.88% |
| USD | $1.00 | 41,895,905 | 61,837,042 | 67.75% |
And here are the charts, based on data collected daily since April 10, 2021.
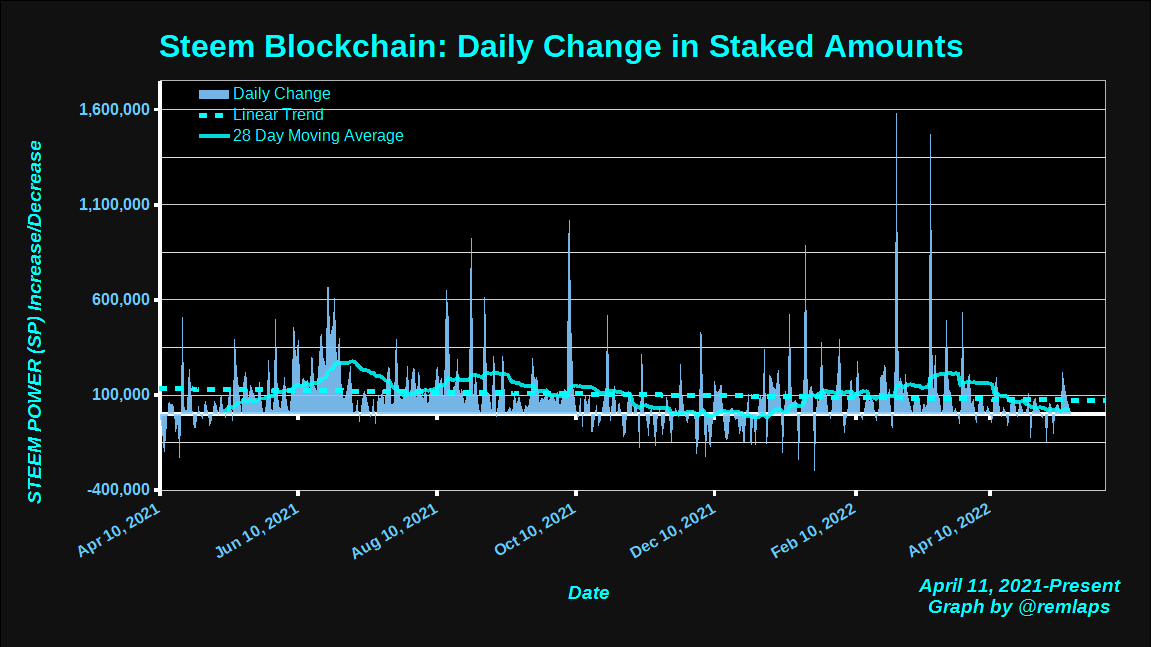
Daily Changes
Here is a chart of daily changes in powered-up STEEM from April 11, 2021 to present. The graph also includes a linear trend line and a 28 day moving average.
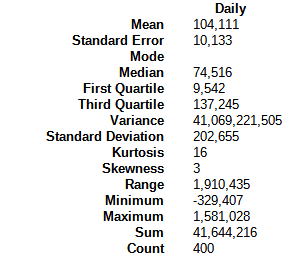
Here are some descriptive statistics, for numbers geeks.
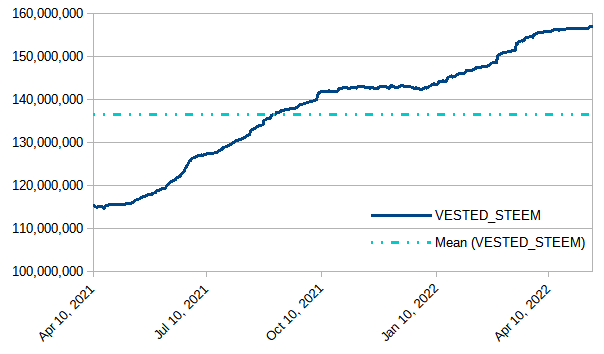
VESTED STEEM
With a weekly gain of about 600k, we may be seeing the beginnings of a renewed upward slope in the graph.
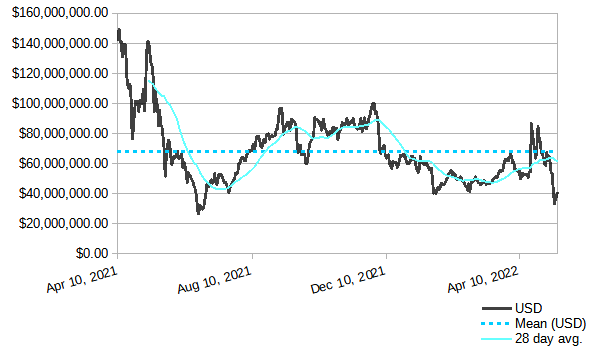
Modeled value of powered-up STEEM in terms of USD
In terms of USD, we saw a weekly decrease of about 20 million dollars, or 33%. With today's observation at $41 million, the value may have bounced off its May 12 bottom near $34 million, and it remains above the lows from June, 2021.
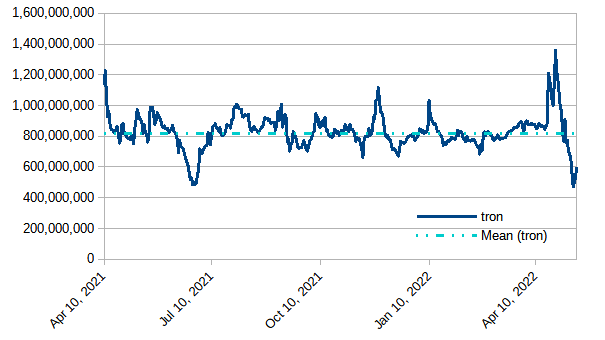
Modeled value of powered-up STEEM in terms of Tron (TRX)
TRX has shown continuing strength in a mostly down market, and gained ground against powered-up STEEM by about 100 million tokens or 14%. This staying power may make the Steem ecosystem more attractive to some because the Steem blockchain provides a mechanism for people to get TRX tokens by blogging and curating Steem's social media content.
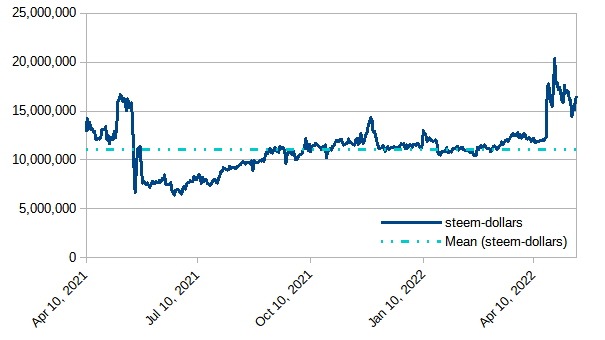
Modeled value of powered-up STEEM in terms of Steem Dollars
Down by about 476K or just shy of 3%
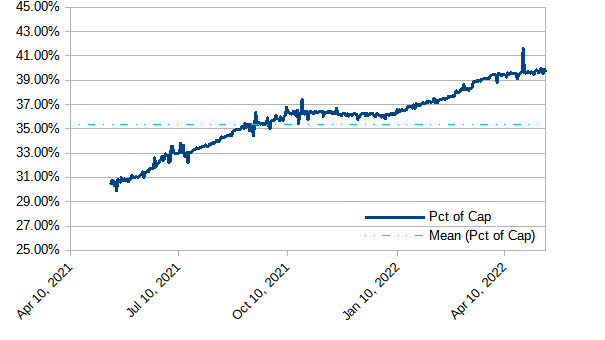
Modeled value of powered-up STEEM as a percentage of Steem's market cap
Running basically flat for the last five weeks, with an anomalous spike on April 27. With today's observed value of 39.67%, we have now seen 41 consecutive days above 39%; 74 consecutive days above 38%; 105 consecutive days above 37%; 232 consecutive days above 35%; and 295 straight days above 1/3. After three months of upslope, the graph seems to have leveled off. Will it hold above 39%? Will it go above 40%?
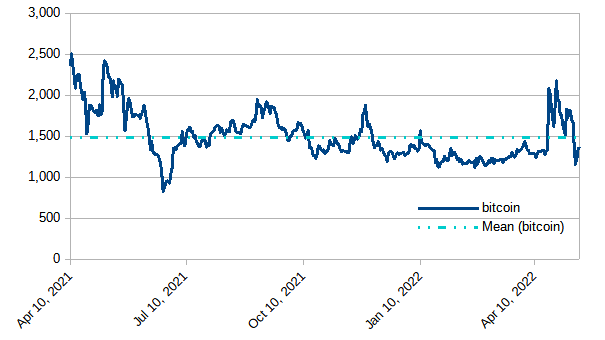
Modeled value of powered-up STEEM in terms of bitcoin (BTC)
Down by about 438 BTC, or 24% during the week.
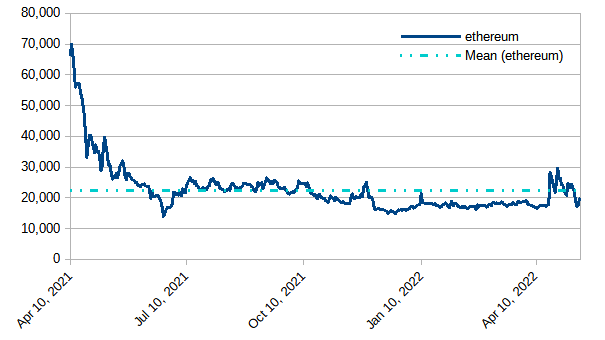
Modeled value of powered-up STEEM in terms of Ethereum
Down by about 4,500 ETH, or almost 14%.
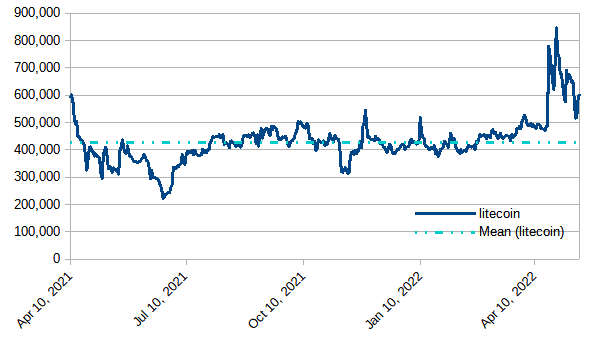
Modeled value of powered-up STEEM in terms of Litecoin
Powered-up STEEM lost ground by about 63,000 LTC, or 9 1/2%. Still running above the historical average.
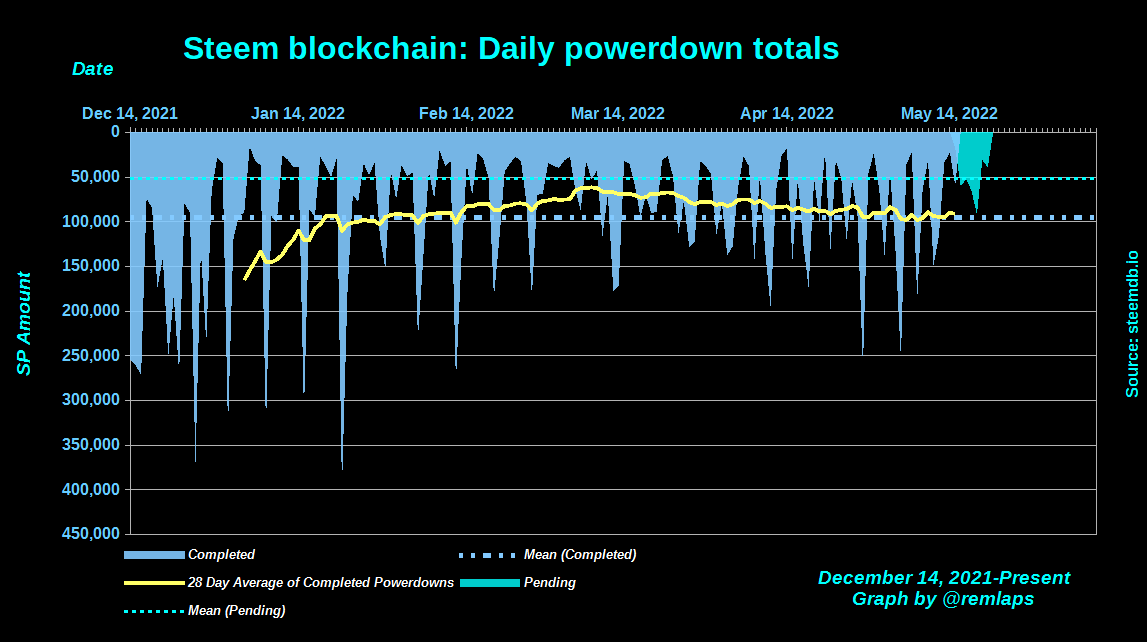
Daily Powerdown Activity
Here is graph with data from steemdb.io to show daily completed and pending powerdown activity. Overall, with about 605K powered down last week and 420K pending, we can expect weekly powerdowns to decrease by about 30% or more.
The horizontal lines are the average values for completed (blue) and pending (cyan) powerdowns, and the yellow line is a 28 day moving average of completed powerdowns.
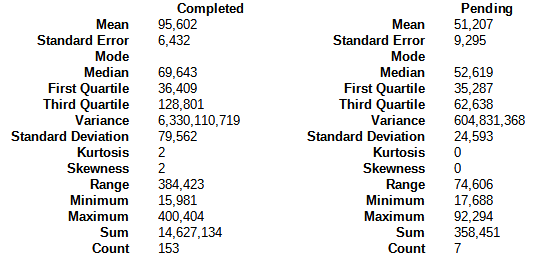
Here are some descriptive statistics for the numbers geeks:
And here are the times, dates, and amounts of the top-10 pending powerdowns:
 1  2022-05-22T16:03:03 - 236,087,927 MVESTS, 129,801 STEEM
 2  2022-05-19T03:17:24 - 91,022,194 MVESTS, 50,044 STEEM
 3  2022-05-21T10:50:00 - 46,989,566 MVESTS, 25,835 STEEM
 4  2022-05-18T11:21:09 - 32,121,262 MVESTS, 17,660 STEEM
 5  2022-05-16T06:43:00 - 28,446,330 MVESTS, 15,640 STEEM
 6  2022-05-17T07:53:45 - 23,997,968 MVESTS, 13,194 STEEM
 7  2022-05-18T15:33:42 - 19,119,268 MVESTS, 10,512 STEEM
 8  2022-05-19T12:01:09 - 18,849,430 MVESTS, 10,363 STEEM
 9  2022-05-22T15:34:33 - 18,134,861 MVESTS, 9,971 STEEM
10  2022-05-17T16:43:15 - 17,760,572 MVESTS, 9,765 STEEM
Notes
- Reference prices for STEEM and other tokens are downloaded from coingecko.com
Previous posts
- Steem Total Value Powered Up - $67 million - January 2,
20212022 - Steem Total Value Powered Up - $57 million - January 9, 2022
- Steem Total Value Powered Up - $60 million - January 16, 2022
- Steem Total Value Powered Up - $43 million - January 23, 2022
- Steem Total Value Powered Up - $46 million - January 30, 2022
- Steem Total Value Powered Up - $54 million - February 6, 2022
- Steem Total Value Powered Up - $50 million - February 13, 2022
- Steem Total Value Powered Up - $46 million - February 20, 2022
- Steem Total Value Powered Up - $48 million - February 27, 2022
- Steem Total Value Powered Up - $47 million - March 6, 2022
- Steem Total Value Powered Up - $47 million - March 13, 2022
- Steem Total Value Powered Up - $51 million - March 20, 2022
- Steem Total Value Powered Up - $60 million - March 27, 2022
- Steem Total Value Powered Up - $65 million - April 3, 2022
- Steem Total Value Powered Up - $55 million - April 10, 2022
- Steem Total Value Powered Up - $68 million - April 24, 2022
- Steem Total Value Powered Up - $67 million - May 1, 2022
- Steem Total Value Powered Up - $62 million - May 8, 2022
- Steem Total Value Powered Up - $42 million - May 15, 2022
Comments