Steem Total Value Powered Up - $50 million - February 13, 2022
12 comments
This is next in my series of posts reviewing the amount and value of powered up STEEM on the Steem blockchain. For previous posts, see the end of this entry.
Noteworthy in the last week,
- As a percentage of market cap, a new high of 37.5% was observed on Thursday, and the streak of days above 37% extended to 14.
- The number of STEEM powered-up saw 6 daily increases and 5 new highs this week.
- The modeled value of powered-up STEEM declined against all comparison tokens, with declines ranging from 3% against SBD to 10% against LTC.
- The modeled value of powered-up STEEM declined by 9% against the USD.
Here are the numbers as-of a few minutes ago:-
Total value locked in powered-up STEEM (USD): $49,739,862.05
STEEM market cap $133,323,783.89
Locked value in terms of other tokens:
| token | price | locked value equivalent | Jan 1, 2022 | pct of Jan 1 baseline |
|---|---|---|---|---|
| tron | $0.06 | 771,268,270 | 809,173,538 | 95.32% |
| steem-dollars | $4.53 | 10,980,101 | 11,284,131 | 97.31% |
| bitcoin | $42,299.00 | 1,175 | 1,300 | 90.42% |
| ethereum | $2,895.09 | 17,180 | 16,501 | 104.12% |
| litecoin | $125.98 | 394,823 | 411,561 | 95.93% |
| steem | $0.34 | 147,455,138 | 142,930,214 | 103.17% |
| USD | $1.00 | 49,739,862 | 61,837,042 | 80.44% |
And here are the charts, based on data collected daily since April 10.
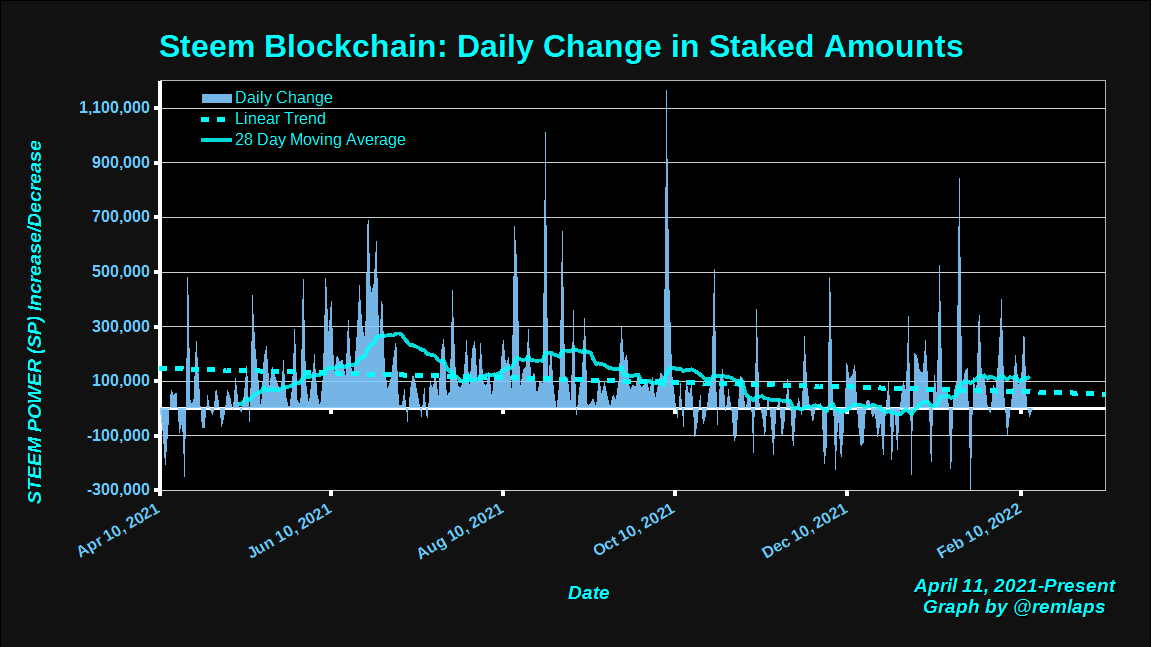
Daily Changes
Here is a chart of daily changes in powered-up STEEM from April 11 to present. The graph also includes a linear trend line and a 28 day moving average.
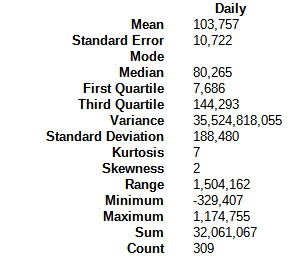
Here are some descriptive statistics, for numbers geeks.
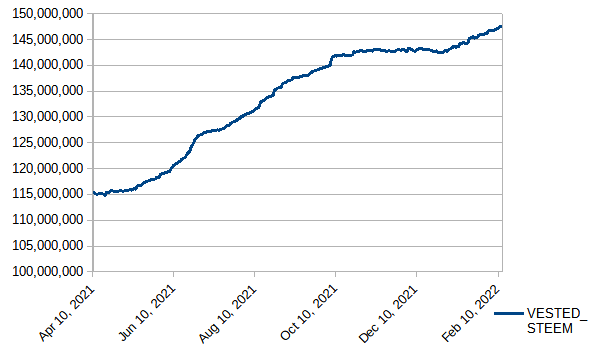
VESTED STEEM
This week saw six out of seven daily increases and also new highs on five of those days. Also, the graph has clearly reestablished an upward slope during the last six weeks.
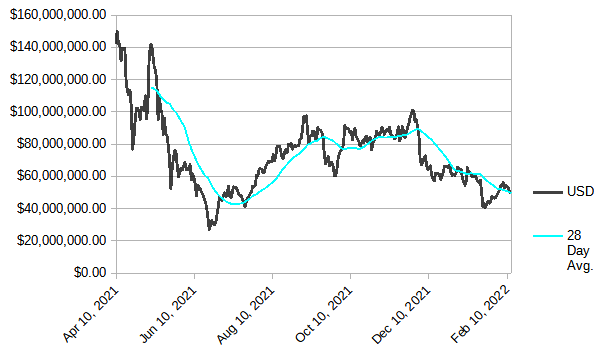
Modeled value of powered-up STEEM in terms of USD
In terms of USD, we saw a weekly decrease of approximately $5 million, or 9%. The value remains above its summertime and more recent lows.
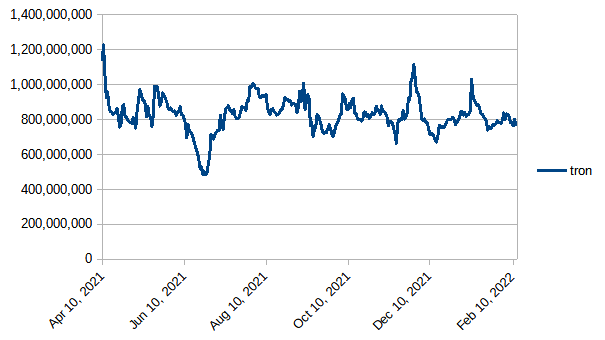
Modeled value of powered-up STEEM in terms of Tron (TRX)
Tron gained strength against powered-up STEEM by 58 million tokens, or about 7%. The total continues to bounce around the 800 million line.
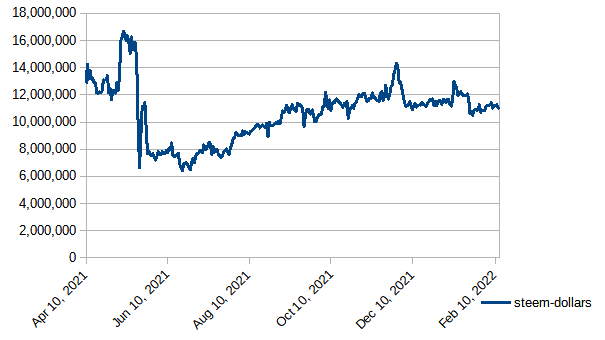
Modeled value of powered-up STEEM in terms of Steem Dollars
Down by about 350k SBDs, or 3% this week.
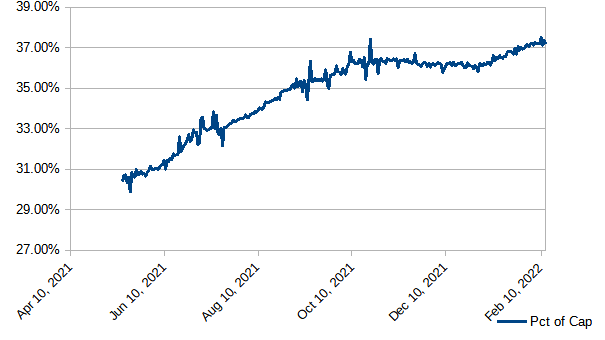
Modeled value of powered-up STEEM as a percentage of Steem's market cap
Up again this week. It reached a new high at 37 1/2% on Thursday and held steady above the 37% line. We have now seen 14 consecutive days above 37%, 44 consecutive days above 36%; 141 consecutive days above 35%; 184 consecutive days above 34%; and 204 straight days above 1/3. Also, the graph has started to reestablish an upward-seeming slope in recent weeks. Will it hold above 37%? Will it reach new highs or even go above 38%?
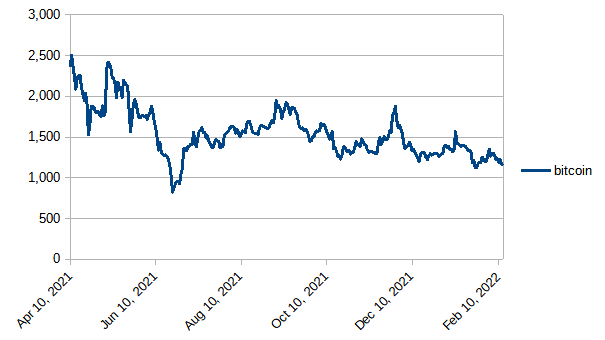
Modeled value of powered-up STEEM in terms of bitcoin (BTC)
Down by about 126 BTC, or just under 10%, during the week.
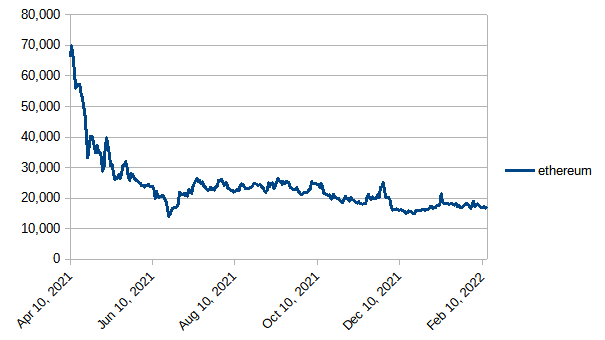
Modeled value of powered-up STEEM in terms of Ethereum
Down by about 825 ETH, or 5%, in the last week.
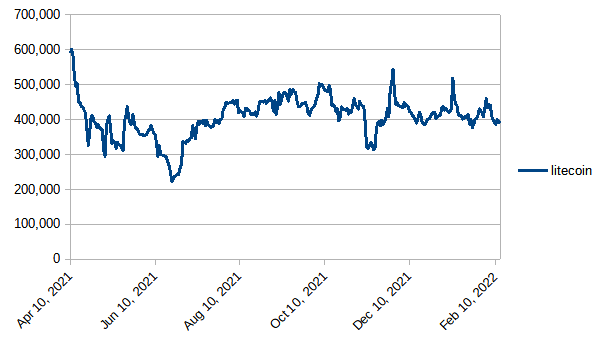
Modeled value of powered-up STEEM in terms of Litecoin
Powered-up STEEM declined by about 44K LTC, or 10%. Still hanging around the 400k - 500k band.
Daily Powerdown Activity
Here is graph with data from steemdb.io to show daily completed and pending powerdown activity. Overall, with about 630k powered down last week and 525k pending, we can expect an overall decrease in powerdowns by about 16% or more in the coming week.
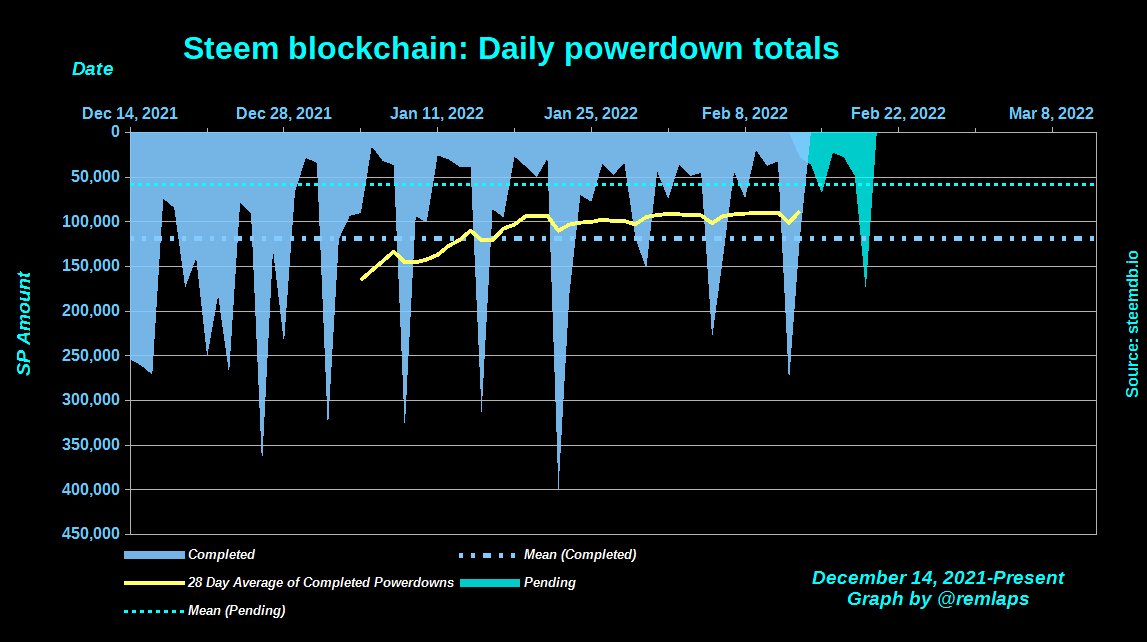
The horizontal lines are the average values for completed (blue) and pending (cyan) powerdowns, and the yellow line is a 28 day moving average of completed powerdowns.
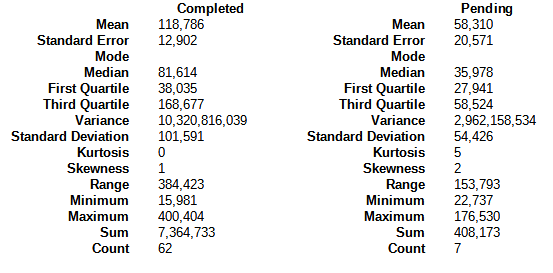
Here are some descriptive statistics for the numbers geeks:
Notes
- Reference prices for STEEM and other tokens are downloaded from coingecko.com
Previous posts
- Steem Total Value Powered Up - $67 million - January 2,
20212022 - Steem Total Value Powered Up - $57 million - January 9, 2022
- Steem Total Value Powered Up - $60 million - January 16, 2022
- Steem Total Value Powered Up - $43 million - January 23, 2022
- Steem Total Value Powered Up - $46 million - January 30, 2022
- Steem Total Value Powered Up - $54 million - February 6, 2022
- Steem Total Value Powered Up - $50 million - February 13, 2022
Comments