Steem Total Value Powered Up - $43 million - January 23, 2022
17 comments
This is next in my series of posts reviewing the amount and value of powered up STEEM on the Steem blockchain. For previous posts, see the end of this entry.
Noteworthy in the last week,
- Once again, the week was dominated by intense downturns across the board in the crypto markets.
- With an increase of about 1.1 million STEEM, or 0.76%, this week saw 6 daily increases and 4 new highs in the modeled number of STEEM that are powered up.
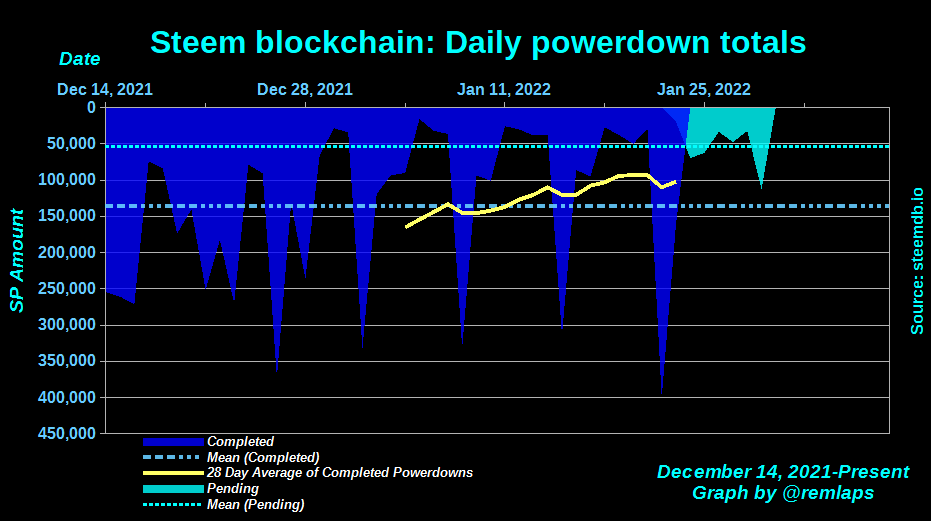
- At about 400,000 tokens powered down, yesterday represented the highest day of powerdowns since I started tracking it in early December. This led to a weekly total of 726k STEEM powered down.
- With about 540k STEEM pending powerdowns in the next week, the anticipated week over week change is a reduction in powerdowns by about 25% or more.
- The daily powerdown graph has been updated to show the mean value trend lines for completed and pending powerdowns (see the last chart).
- In terms of USD, the modeled value for powered-up STEEM is down by $17 million, or 29% in the last week. It is also down in terms of all comparison tokens.
- The modeled value for powered-up STEEM is up, slightly, as a percentage of market capitalization.
Here are the numbers as-of a few minutes ago:-
Total value locked in powered-up STEEM (USD): $42,819,177.80
STEEM market cap $116,356,697.60
Locked value in terms of other tokens:
| token | price | locked_value equivalent |
|---|---|---|
| tron | 0.06 | 762,422,595 |
| steem-dollars | 3.98 | 10,758,587 |
| bitcoin | 35,086.00 | 1,220 |
| ethereum | 2,424.46 | 17,661 |
| litecoin | 107.13 | 399,693 |
| steem | 0.29 | 145,221,628 |
And here are the charts, based on data collected daily since April 10.
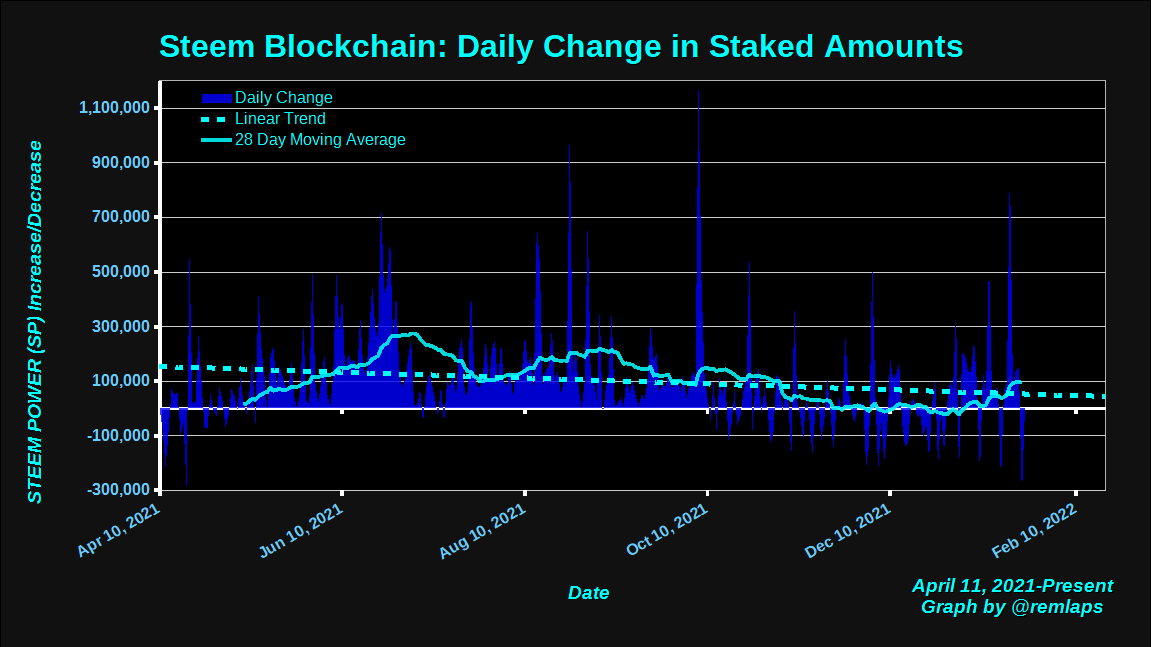
Daily Changes
Here is a chart of daily changes in powered-up STEEM from April 11 to present. The graph also includes a linear trend line and a 28 day moving average. With six out of seven daily increases for three consecutive weeks and a low number of Pending powerdowns in the coming week, the frequent transitions between positive and negative that began around October 11 may be showing signs of slowing.
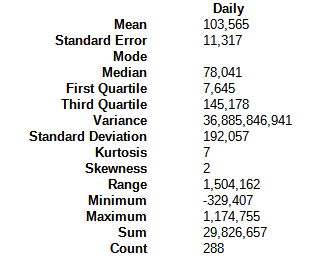
New: Here are some descriptive statistics, for numbers geeks.
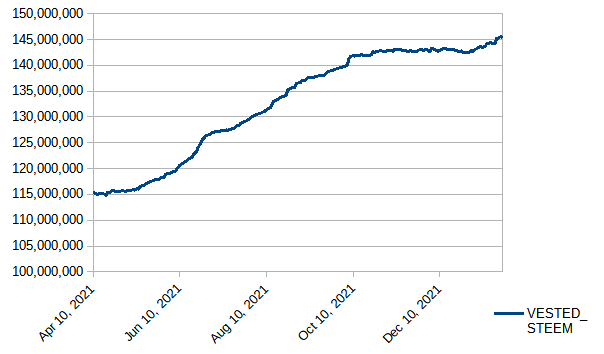
VESTED STEEM
This week we saw four new highs and six daily increases. Also, the graph has clearly reestablished an upward slope during the last three weeks.
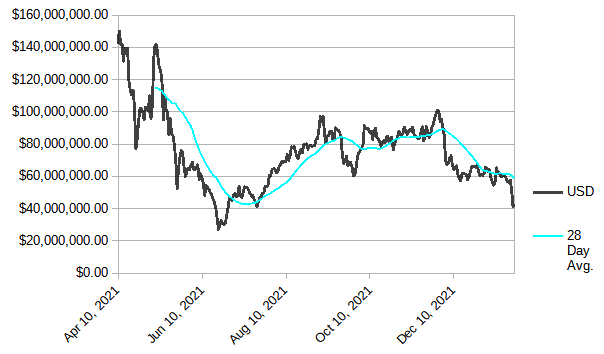
Modeled value of powered-up STEEM in terms of USD
In terms of USD, we saw a decrease by approximately $17 million, or 29% from week to week. The value remains slightly above its summertime lows.
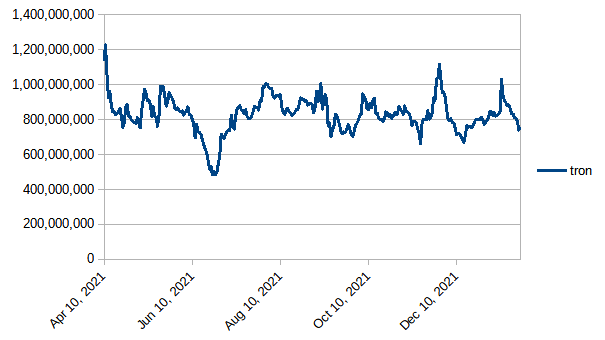
Modeled value of powered-up STEEM in terms of Tron (TRX)
Tron gained in strength against powered-up STEEM by 104 million tokens, or about 12%. The total dropped below 800 million for the first time in the 2022 calendar year.
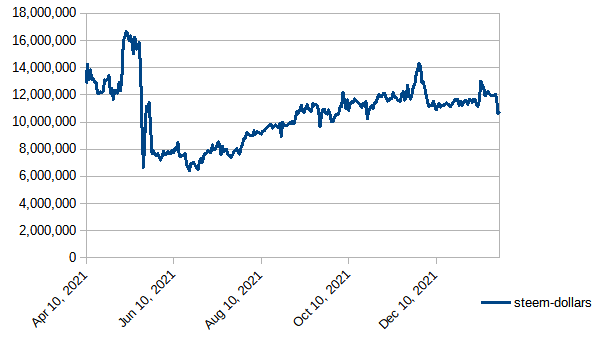
Modeled value of powered-up STEEM in terms of Steem Dollars
Down by about 1.3 million SBD or just under 11% during the last week. This suggests that it is now a bit cheaper to buy STEEM with our SBD rewards.
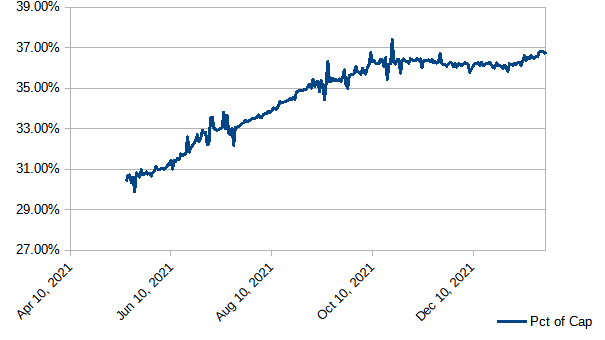
Modeled value of powered-up STEEM as a percentage of Steem's market cap
Up - just a touch - again this week, hanging around in the mid-upper 36% range. We have now seen 23 consecutive days above 36%; 120 consecutive days above 35%; 163 consecutive days above 34%; and 183 straight days above 1/3. Will it hold above 36%? Will we go above 37% again?
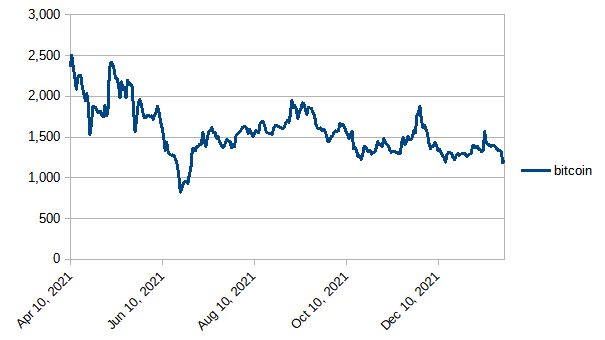
Modeled value of powered-up STEEM in terms of bitcoin (BTC)
Down by about 182 BTC, or 13%, during the week.
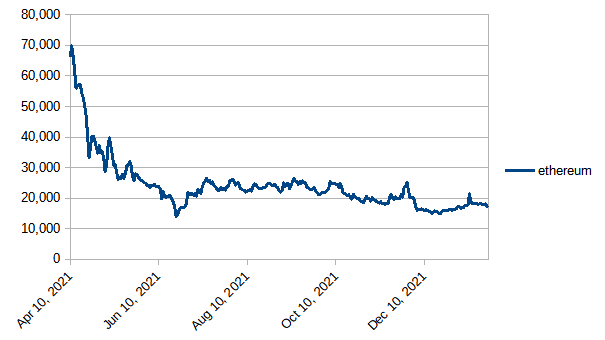
Modeled value of powered-up STEEM in terms of Ethereum
Down by 364 ETH, or about 2%, in the last week.
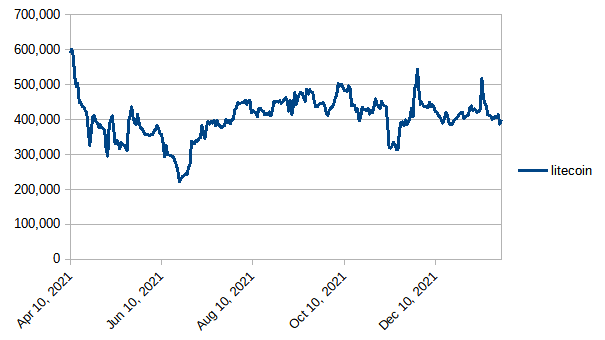
Modeled value of powered-up STEEM in terms of Litecoin
LTC gained strength by about 11k LTC, or 2.7%. Still hanging out near the 400k - 500k band.
Daily Powerdown Activity
Here is graph with data from steemdb.io to show daily completed and pending powerdown activity. Overall, with about 727k powered down last week and 540k pending, we expect an overall decrease in powerdowns by 25% or more in the coming week. The graph was updated this week to include mean trend lines for Completed and Pending powerdowns.
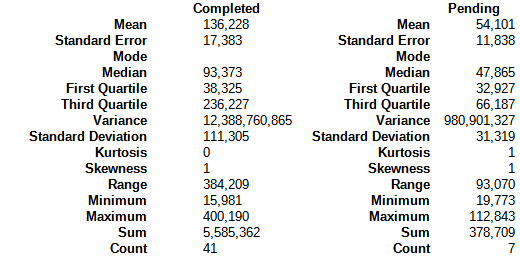
Here are some descriptive statistics for the numbers geeks:
Notes
- Reference prices for STEEM and other tokens are downloaded from coingecko.com
Previous posts
- Steem Total Value Powered Up - $102 million (Apr 30)
- Steem Total Value Powered Up - $158 million (May 7)
- Steem Total Value Powered Up - $108 million - May 14, 2021
- Steem Total Value Powered Up - $77 million - May 21, 2021
- Steem Total Value Powered Up - $64 million - May 28, 2021
- Steem Total Value Powered Up - $64 million - June 4, 2021
- Steem Total Value Powered Up - $55 million - June 11, 2021
- Steem Total Value Powered Up - $47 million - July 16, 2021
- Steem Total Value Powered Up - $48 million - July 23, 2021
- Steem Total Value Powered Up - $62 million - July 30, 2021
- Steem Total Value Powered Up - $67 million - August 6, 2021
- Steem Total Value Powered Up - $74 million - August 13, 2021
- Steem Total Value Powered Up - $75 million - August 20, 2021
- Steem Total Value Powered Up - $80 million - August 27, 2021
- Steem Total Value Powered Up - $89 million - September 3, 2021
- Steem Total Value Powered Up - $89 million - September 12, 2021
- Steem Total Value Powered Up - $86 million - September 19, 2021
- Steem Total Value Powered Up - $68 million - September 26, 2021
- Steem Total Value Powered Up - $76 million - October 3, 2021
- Steem Total Value Powered Up - $88 million - October 10, 2021
- Steem Total Value Powered Up - $83 million - October 17, 2021
- Steem Total Value Powered Up - $83 million - October 24, 2021
- Steem Total Value Powered Up - $88 million - October 31, 2021
- Steem Total Value Powered Up - $87 million - November 7, 2021
- Steem Total Value Powered Up - $83 million - November 14, 2021
- Steem Total Value Powered Up - $87 million - November 21, 2021
- Steem Total Value Powered Up - $104 million - November 28, 2021
- Steem Total Value Powered Up - $66 million - December 5, 2021
- Steem Total Value Powered Up - $66 million - December 12, 2021
- Steem Total Value Powered Up - $61 million - December 19, 2021
- Steem Total Value Powered Up - $66 million - December 26, 2021
- Steem Total Value Powered Up - $67 million - January 2,
20212022 - Steem Total Value Powered Up - $57 million - January 9, 2022
- Steem Total Value Powered Up - $60 million - January 16, 2022
- Steem Total Value Powered Up - $43 million - January 23, 2022
Comments