Steem Total Value Powered Up - $66 million - December 26, 2021
11 comments
This is next in my series of posts reviewing the amount and value of powered up STEEM on the Steem blockchain. For previous posts, see the end of this entry.
Noteworthy in the last week,
- The modeled value for powered up STEEM gained by about $4 million, or 6% against the USD.
- Continued sideways movement in the reported number of powered-up STEEM. No new highs in the last 13 days.
- The modeled value for powered up STEEM was flat against SBD and BTC.
- The percent of market cap powered up was also flat.
- The modeled value for powered up STEEM showed modest gains against ETH (2.4%), TRX (5.3%) and LTC (6.4%).
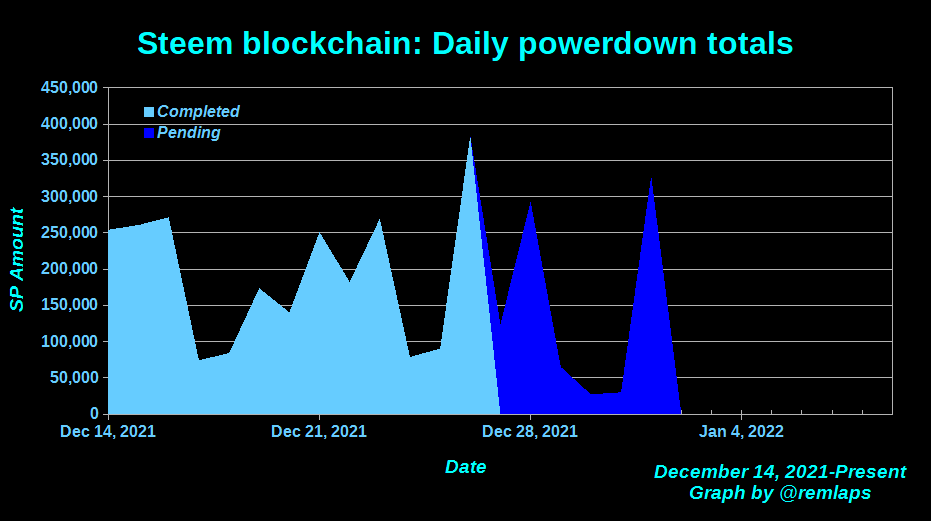
- For powerdowns, SteemDB shows 1,538,409 STEEM powered down in the last week, and 902,629 STEEM pending in the next week. This reflects a week-over-week reduction of 41.33%, but pending numbers do not include Sunday, Jan 2, so it's not necessarily the best comparison. (If we do a week over week comparison from Monday through Saturday, the days with complete numbers, we see a reduction of about 14%.)
- - See the new graph at the bottom of this week's data for completed and pending powerdown activity.
Here are the numbers as-of a few minutes ago:
Total value locked in powered-up STEEM (USD): $65,625,341.17
STEEM market cap $181,495,134.70
Locked value in terms of other tokens:
| token | price | locked_value equivalent |
|---|---|---|
| tron | 0.08 | 805,545,081 |
| steem-dollars | 5.80 | 11,314,713 |
| bitcoin | 50,404.00 | 1,301 |
| ethereum | 4,080.47 | 16,082 |
| litecoin | 156.31 | 419,840 |
| steem | 0.46 | 142,567,707 |
And here are the charts, based on data collected daily since April 10.
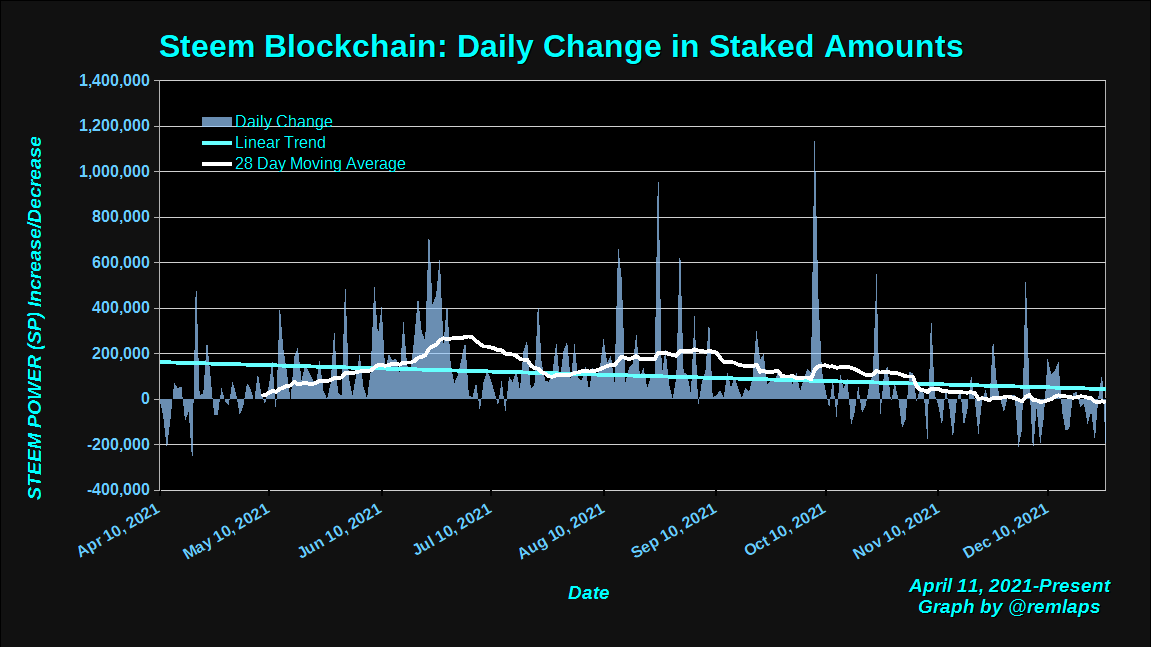
Daily Changes
Here is a chart of daily changes in powered-up STEEM from April 11 to present. The graph also includes a linear trend line and a 28 day moving average. Frequent transitions between positive and negative began around October 11 and continued through this week.
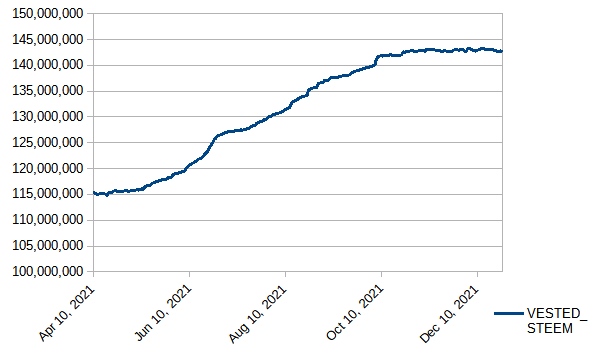
VESTED STEEM
Continued flattening. No new highs this week, with a tiny overall decline of 1/2 million STEEM, or about 0.3%.
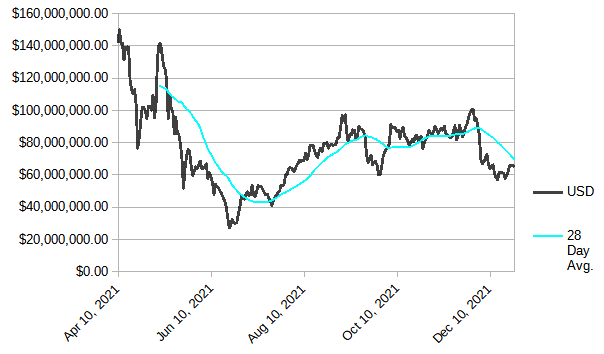
Modeled value of powered-up STEEM in terms of USD
In terms of USD, the modeled value for powered-up STEEM was up by about $4 million, or 6.6%.
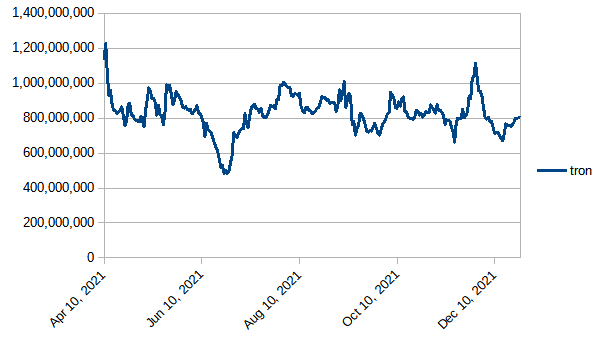
Modeled value of powered-up STEEM in terms of Tron (TRX)
This week, the modeled value for powered-up STEEM gained in strength against TRX by about 40 million TRX tokens, or 5 1/2% and clawed its way back above 800 million TRX.
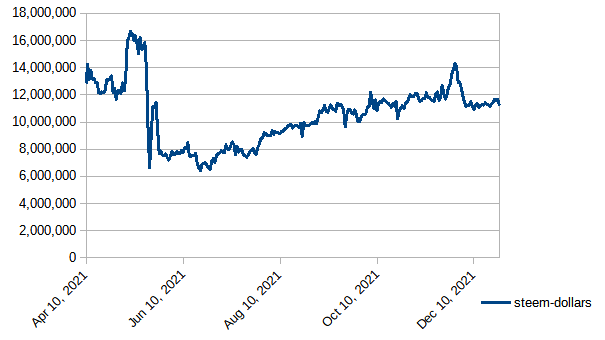
Modeled value of powered-up STEEM in terms of Steem Dollars
Down by about 40k SBD, or just under 1/2% during the last week.
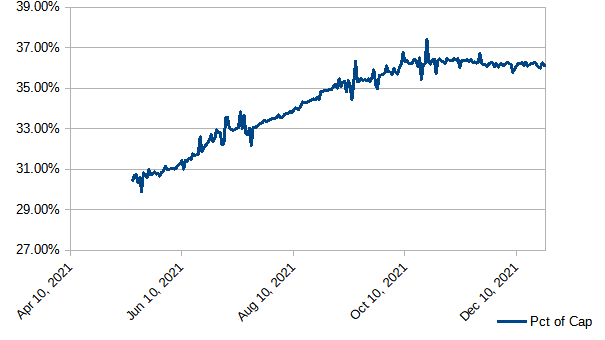
Modeled value of powered-up STEEM as a percentage of Steem's market cap
Still flat since early October. We have now seen 17 consecutive days above 36%; 92 consecutive days above 35%; 135 consecutive days above 34%; and 155 straight days above 1/3. Will it hold above 36%? Will we go above 37% again?
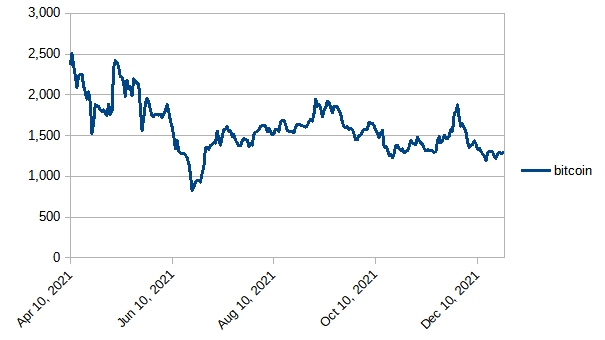
Modeled value of powered-up STEEM in terms of bitcoin (BTC)
BTC gained in strength against the modeled value for powered-up STEEM by about 4 BTC, well under 1%, during the week.
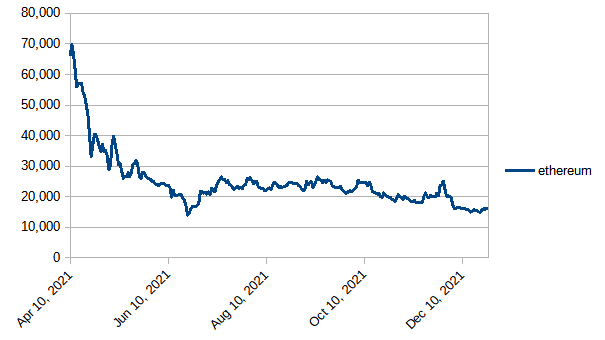
Modeled value of powered-up STEEM in terms of Ethereum
Up by 377 ETH or ~2.4% in the last week.
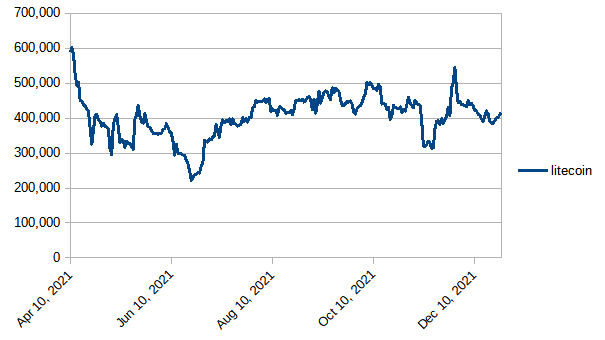
Modeled value of powered-up STEEM in terms of litecoin
In terms of LTC, the modeled value of powered up STEEM gained by about 6.4% or 25K LTC. Still hanging around near the 400k - 500k band.
Daily Powerdown Activity
Finally, here is a new graph with data from steemdb.io to show daily completed and pending powerdown activity.
Note that today's number reflects a combination of completed and pending.
Notes
- Reference prices for STEEM and other tokens are downloaded from coingecko.com
Previous posts
- Steem Total Value Powered Up - $102 million (Apr 30)
- Steem Total Value Powered Up - $158 million (May 7)
- Steem Total Value Powered Up - $108 million - May 14, 2021
- Steem Total Value Powered Up - $77 million - May 21, 2021
- Steem Total Value Powered Up - $64 million - May 28, 2021
- Steem Total Value Powered Up - $64 million - June 4, 2021
- Steem Total Value Powered Up - $55 million - June 11, 2021
- Steem Total Value Powered Up - $47 million - July 16, 2021
- Steem Total Value Powered Up - $48 million - July 23, 2021
- Steem Total Value Powered Up - $62 million - July 30, 2021
- Steem Total Value Powered Up - $67 million - August 6, 2021
- Steem Total Value Powered Up - $74 million - August 13, 2021
- Steem Total Value Powered Up - $75 million - August 20, 2021
- Steem Total Value Powered Up - $80 million - August 27, 2021
- Steem Total Value Powered Up - $89 million - September 3, 2021
- Steem Total Value Powered Up - $89 million - September 12, 2021
- Steem Total Value Powered Up - $86 million - September 19, 2021
- Steem Total Value Powered Up - $68 million - September 26, 2021
- Steem Total Value Powered Up - $76 million - October 3, 2021
- Steem Total Value Powered Up - $88 million - October 10, 2021
- Steem Total Value Powered Up - $83 million - October 17, 2021
- Steem Total Value Powered Up - $83 million - October 24, 2021
- Steem Total Value Powered Up - $88 million - October 31, 2021
- Steem Total Value Powered Up - $87 million - November 7, 2021
- Steem Total Value Powered Up - $83 million - November 14, 2021
- Steem Total Value Powered Up - $87 million - November 21, 2021
- Steem Total Value Powered Up - $104 million - November 28, 2021
- Steem Total Value Powered Up - $66 million - December 5, 2021
- Steem Total Value Powered Up - $66 million - December 12, 2021
- Steem Total Value Powered Up - $61 million - December 19, 2021
- Steem Total Value Powered Up - $66million - December 26, 2021
Comments