Steem Total Value Powered Up - $68 million - April 24, 2022
11 comments
This is next in my series of posts reviewing the amount and value of powered up STEEM on the Steem blockchain. For previous posts, see the end of this entry.
Noteworthy in the last week,
- Steem is now settling down after a nice pump a few days ago. The pump was likely caused by the addition of a USDT/STEEM trading pair at binance.
- I missed posting last week due to Easter holiday plans. Sorry.
- Week over week, the number of powered up STEEM increased by 186K, or just about 1/10%.
- The week saw 5 daily increases and 4 new highs in number of STEEM powered up.
- At 39.62%, the series-long high as a percentage of market cap was recorded on April 16. This is closely followed by today's score of 39.6%.
- The modeled value of powered-up STEEM gained ground against USD and all comparison tokens.
- Total powerdowns this week totaled 636K STEEM.
- In terms of all comparison tokens, today's locked value is markedly higher than the January 1, 2022 baseline.
- In other news, STEEM outperformed TWTR, NFLX, and FB during the last two years.
Here are the numbers as-of a few minutes ago:
Total value locked in powered-up STEEM (USD): $68,273,034.21
STEEM market cap $172,367,504.49
Locked value in terms of other tokens:
| token | price | locked value equivalent | Jan 1, 2022 | pct of Jan 1 baseline |
|---|---|---|---|---|
| tron | $0.07 | 1,030,240,900 | 809,173,538 | 127.32% |
| steem-dollars | $4.31 | 15,840,611 | 11,284,131 | 140.38% |
| bitcoin | $39,624.00 | 1,723 | 1,300 | 132.58% |
| ethereum | $2,942.94 | 23,198 | 16,501 | 140.59% |
| litecoin | $104.33 | 654,395 | 411,561 | 159.00% |
| steem | $0.44 | 156,438,472 | 142,930,214 | 109.45% |
| USD | $1.00 | 68,273,034 | 61,837,042 | 110.41% |
And here are the charts, based on data collected daily since April 10, 2021.
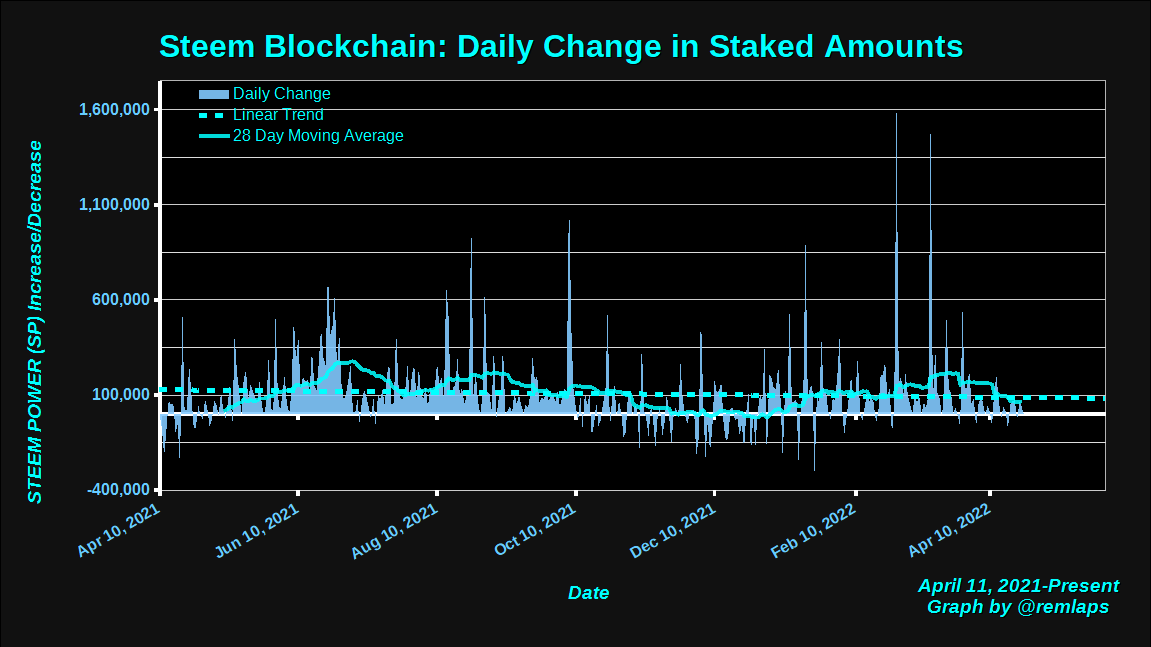
Daily Changes
Here is a chart of daily changes in powered-up STEEM from April 11, 2021 to present. The graph also includes a linear trend line and a 28 day moving average.
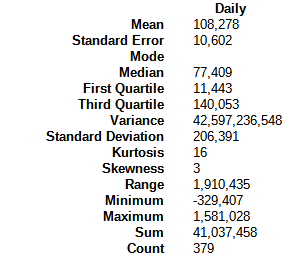
Here are some descriptive statistics, for numbers geeks.
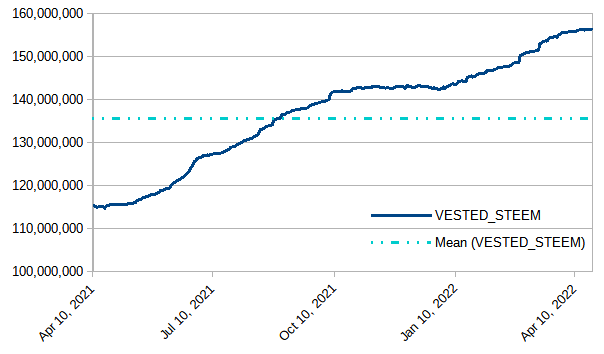
VESTED STEEM
With a weekly increase of about 186 thousand, this week saw five out of seven daily increases and also new highs on 4 days. The graph is continuing to level off.
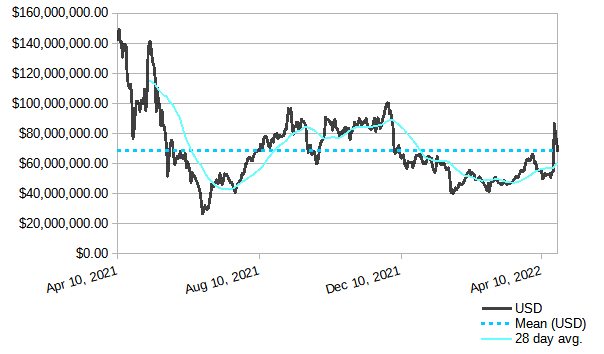
Modeled value of powered-up STEEM in terms of USD
In terms of USD, we saw a weekly increase of about $14 million, or 27%. The value is presently near its series-long average value.
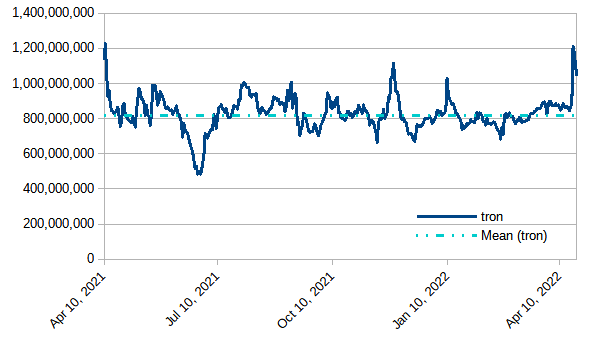
Modeled value of powered-up STEEM in terms of Tron (TRX)
Gained ground against TRX by about 177 million, or 20 1/2%. The daily value didn't quite match the series high from last April, but there have been four consecutive days above 1 billion.
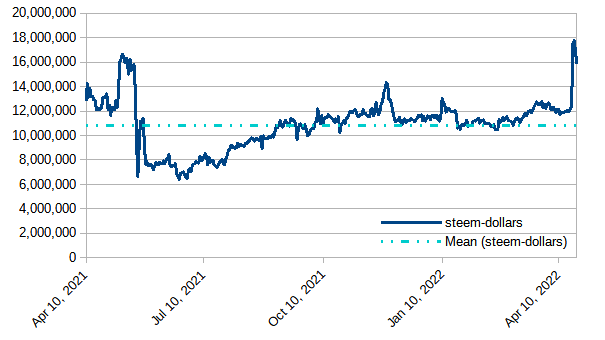
Modeled value of powered-up STEEM in terms of Steem Dollars
Up by about 3.8 million, or 31 1/2%
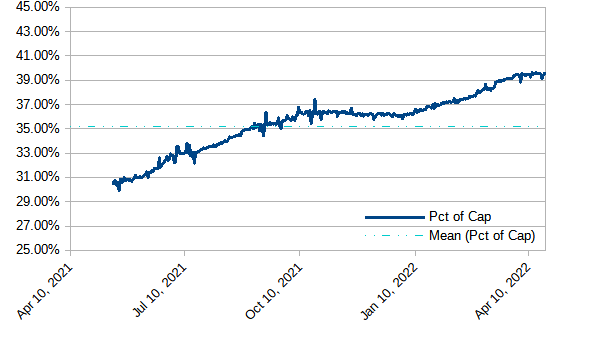
Modeled value of powered-up STEEM as a percentage of Steem's market cap
Running just slightly above flat for the last three weeks. We have now seen 20 consecutive days above 39%; 53 consecutive days above 38%; 84 consecutive days above 37%; 211 consecutive days above 35%; and 274 straight days above 1/3. After three months of upslope, the graph is now leveling off. Will it hold above 39%? Will it go above 40%?
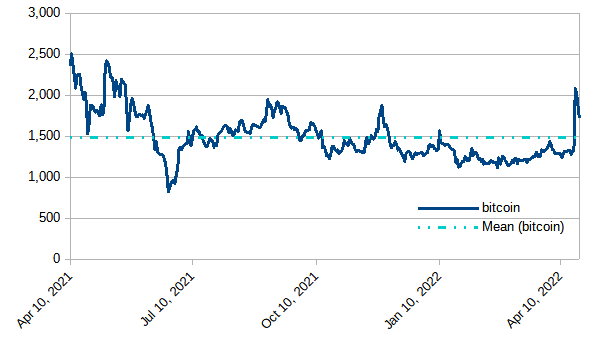
Modeled value of powered-up STEEM in terms of bitcoin (BTC)
Up by about 400 BTC, or 33% during the week.
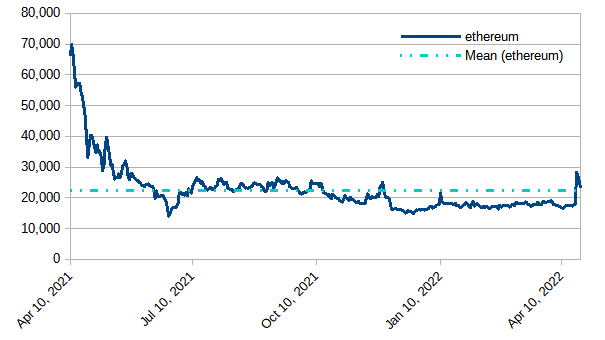
Modeled value of powered-up STEEM in terms of Ethereum
Up by about 5,800 ETH, or 33%.
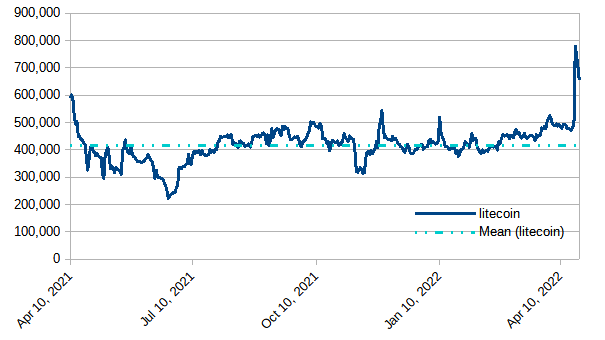
Modeled value of powered-up STEEM in terms of Litecoin
Powered-up STEEM increased by about 180,000 LTC, or about 38%, ending its water-treading near the 400k - 500k band. This is the fourth consecutive day above the previous series-high near 600K.
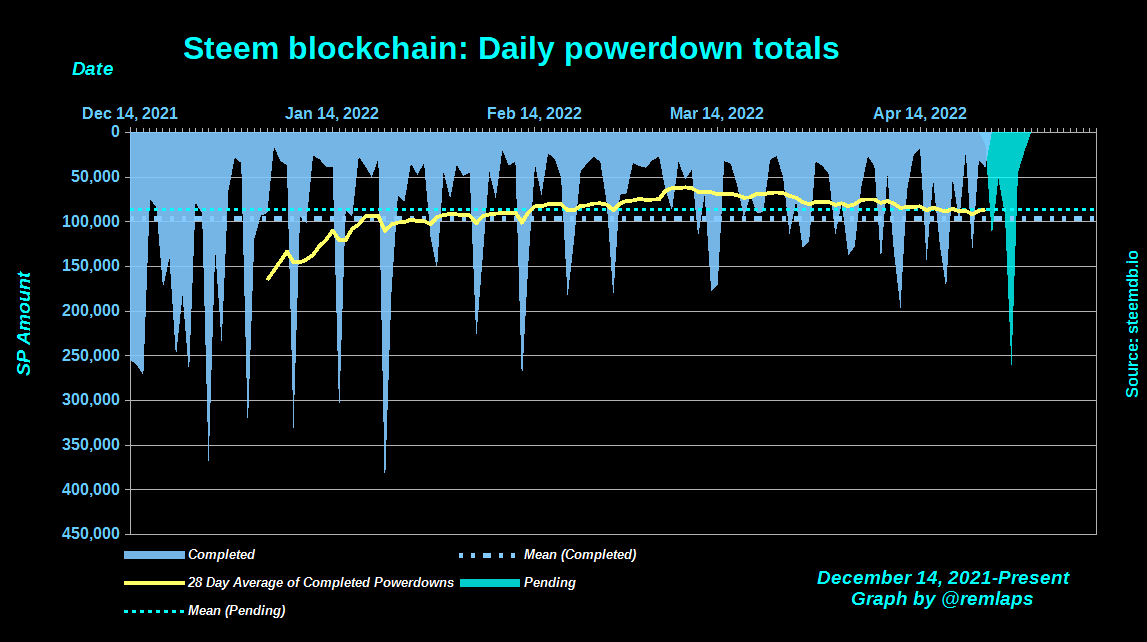
Daily Powerdown Activity
Here is graph with data from steemdb.io to show daily completed and pending powerdown activity. Overall, with about 636K powered down last week and 641K pending, we can expect weekly powerdowns to be basically flat, with a tiny percentage of increase. The big spike in pending powerdowns is exactly a week after the April 21 price pump. That spike represents more than 1/3 of this week's pending powerdowns.
The horizontal lines are the average values for completed (blue) and pending (cyan) powerdowns, and the yellow line is a 28 day moving average of completed powerdowns.
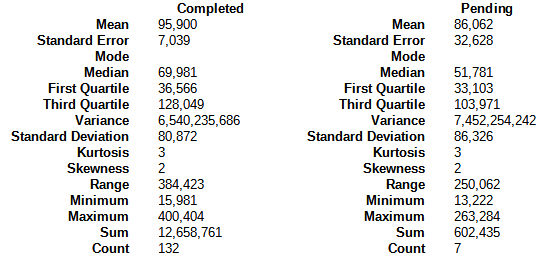
Here are some descriptive statistics for the numbers geeks:
Notes
- Reference prices for STEEM and other tokens are downloaded from coingecko.com
Previous posts
- Steem Total Value Powered Up - $67 million - January 2,
20212022 - Steem Total Value Powered Up - $57 million - January 9, 2022
- Steem Total Value Powered Up - $60 million - January 16, 2022
- Steem Total Value Powered Up - $43 million - January 23, 2022
- Steem Total Value Powered Up - $46 million - January 30, 2022
- Steem Total Value Powered Up - $54 million - February 6, 2022
- Steem Total Value Powered Up - $50 million - February 13, 2022
- Steem Total Value Powered Up - $46 million - February 20, 2022
- Steem Total Value Powered Up - $48 million - February 27, 2022
- Steem Total Value Powered Up - $47 million - March 6, 2022
- Steem Total Value Powered Up - $47 million - March 13, 2022
- Steem Total Value Powered Up - $51 million - March 20, 2022
- Steem Total Value Powered Up - $60 million - March 27, 2022
- Steem Total Value Powered Up - $65 million - April 3, 2022
- Steem Total Value Powered Up - $55 million - April 10, 2022
- Steem Total Value Powered Up - $68 million - April 24, 2022
Comments