Steem Total Value Powered Up - $60 million - March 27, 2022
16 comments
This is next in my series of posts reviewing the amount and value of powered up STEEM on the Steem blockchain. For previous posts, see the end of this entry.
Noteworthy in the last week,
- Week over week, the number of powered up STEEM increased by just under a million, or a bit more than 1/2%.
- As with last week, we saw daily increases and new highs on 6 of 7 days, with a small decrease on Sunday.
- At 39.16%, yesterday was the highest observed day as a percentage of market capitalization.
- The modeled value of powered-up STEEM gained in strength against all comparison tokens, ranging from 5% against ethereum to 8% against BTC.
- The modeled value of powered-up STEEM gained by $9 million, or 18% against the USD.
- The total STEEM powered down decreased by about 25% from 641K powered down last week to 477K this week.
- In terms of all comparison tokens, today's locked value is higher than the January 1, 2022 baseline.
Here are the numbers as-of a few minutes ago:
Total value locked in powered-up STEEM (USD): $60,048,346.78
STEEM market cap $153,432,807.88
Locked value in terms of other tokens:
| token | price | locked value equivalent | Jan 1, 2022 | pct of Jan 1 baseline |
|---|---|---|---|---|
| tron | $0.07 | 879,829,256 | 809,173,538 | 108.73% |
| steem-dollars | $4.77 | 12,588,751 | 11,284,131 | 111.56% |
| bitcoin | $45,782.00 | 1,311 | 1,300 | 100.89% |
| ethereum | $3,210.13 | 18,705 | 16,501 | 113.36% |
| litecoin | $126.18 | 475,894 | 411,561 | 115.63% |
| steem | $0.39 | 154,570,567 | 142,930,214 | 108.14% |
| USD | $1.00 | 60,048,347 | 61,837,042 | 97.11% |
And here are the charts, based on data collected daily since April 10, 2021.
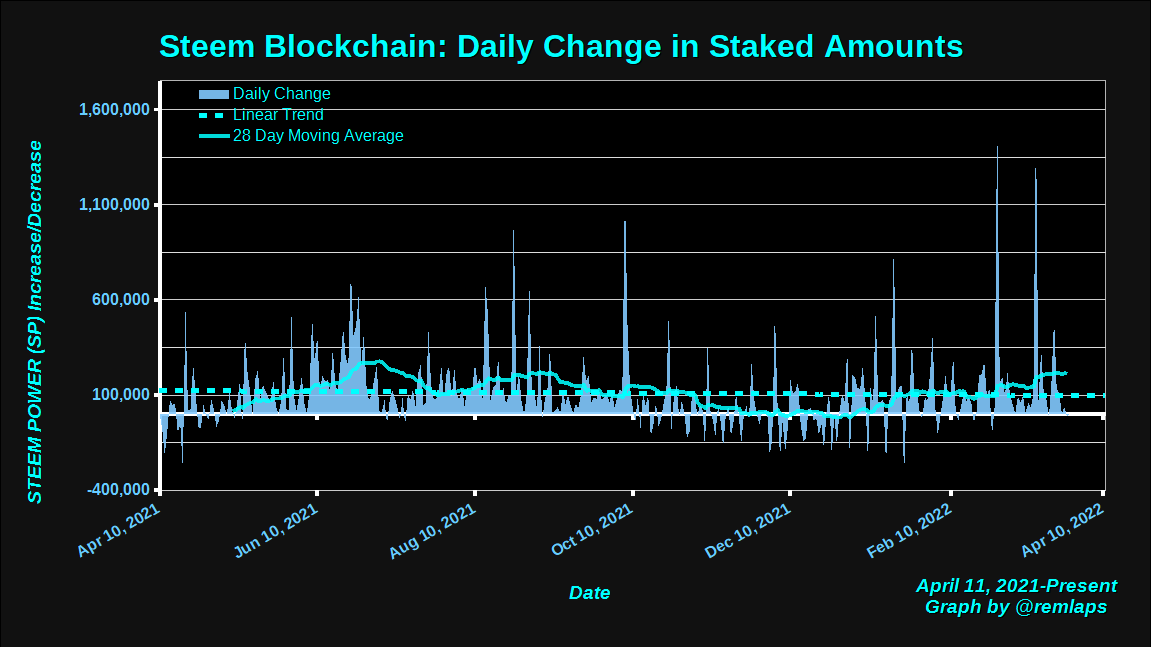
Daily Changes
Here is a chart of daily changes in powered-up STEEM from April 11, 2021 to present. The graph also includes a linear trend line and a 28 day moving average.
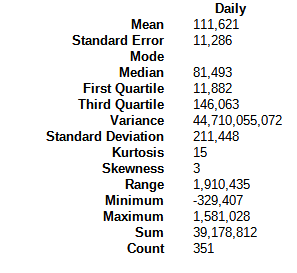
Here are some descriptive statistics, for numbers geeks.
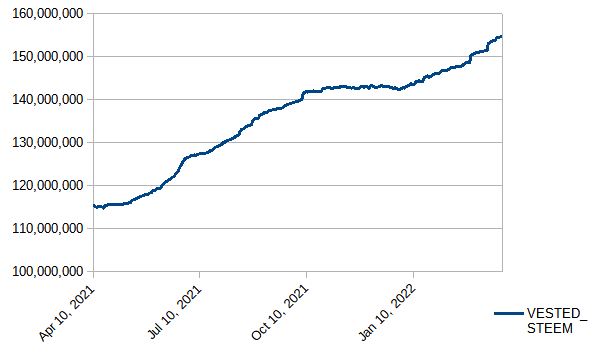
VESTED STEEM
With a weekly increase of about 1 million, this week saw six out of seven daily increases and also new highs each day except for today. This is the twelfth consecutive week with a clear upward slope.
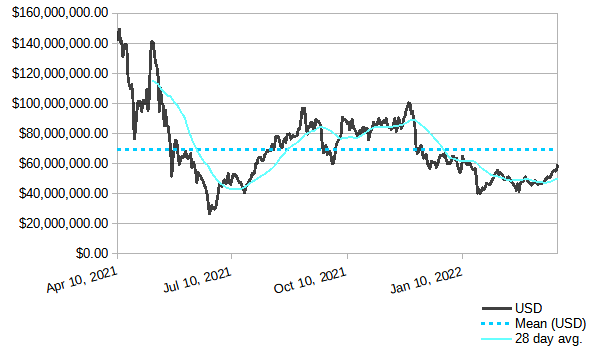
Modeled value of powered-up STEEM in terms of USD
In terms of USD, we saw a weekly increase of about $9 million, or 18%. The value remains above its summertime and more recent lows. I added a "mean value" line to the graph this week, representing the average of all daily observations beginning last April.
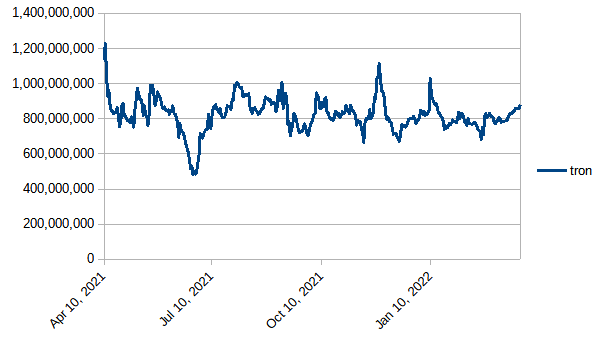
Modeled value of powered-up STEEM in terms of Tron (TRX)
Powered-up STEEM gained against TRX by about 49 million, or about 6%. This puts it back into the previously common channel between 800 million and 1 billion.
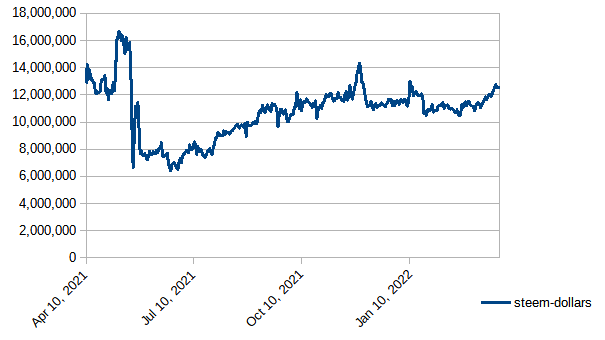
Modeled value of powered-up STEEM in terms of Steem Dollars
Up by about 775K, or 6 1/2%
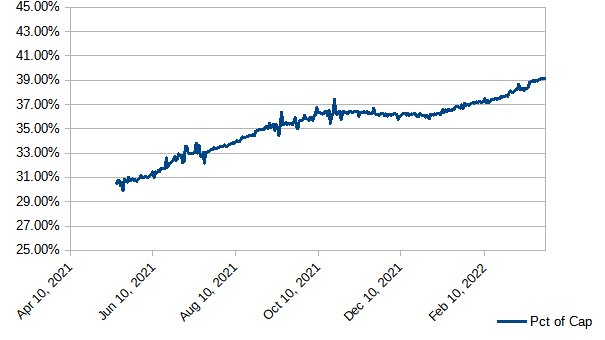
Modeled value of powered-up STEEM as a percentage of Steem's market cap
Gained ground again this week, climbing above 39% and reaching a new high at 39.16% yesterday (March 26). We have now seen 6 consecutive days above 39%; 25 consecutive days above 38%; 56 consecutive days above 37%; 183 consecutive days above 35%; and 246 straight days above 1/3. Also, the graph has started to reestablish an upward-seeming slope since the beginning of 2022. Will it hold above 39%? Will it go above 40%?
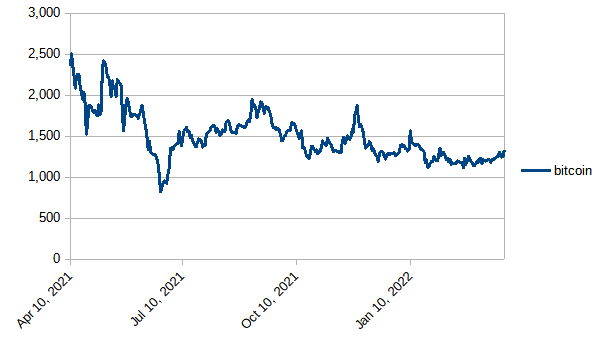
Modeled value of powered-up STEEM in terms of bitcoin (BTC)
Up by about 99 BTC, or 8% during the week.
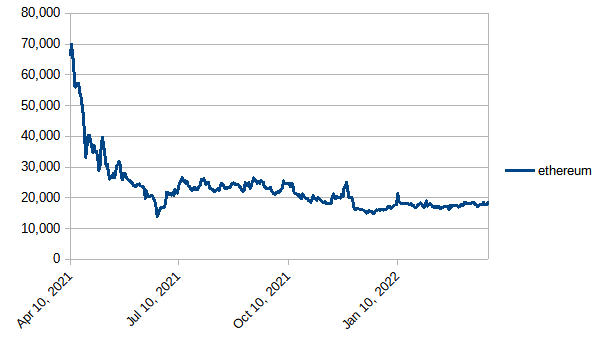
Modeled value of powered-up STEEM in terms of Ethereum
Up by about 941 ETH, or 5 1/4%
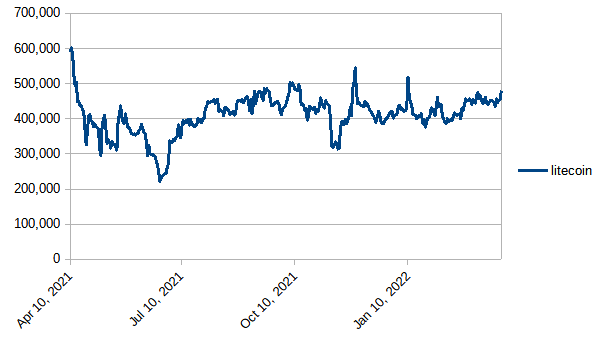
Modeled value of powered-up STEEM in terms of Litecoin
Powered-up STEEM gained by about 29,000 LTC, or about 6 1/2%. Still hanging around the 400k - 500k band.
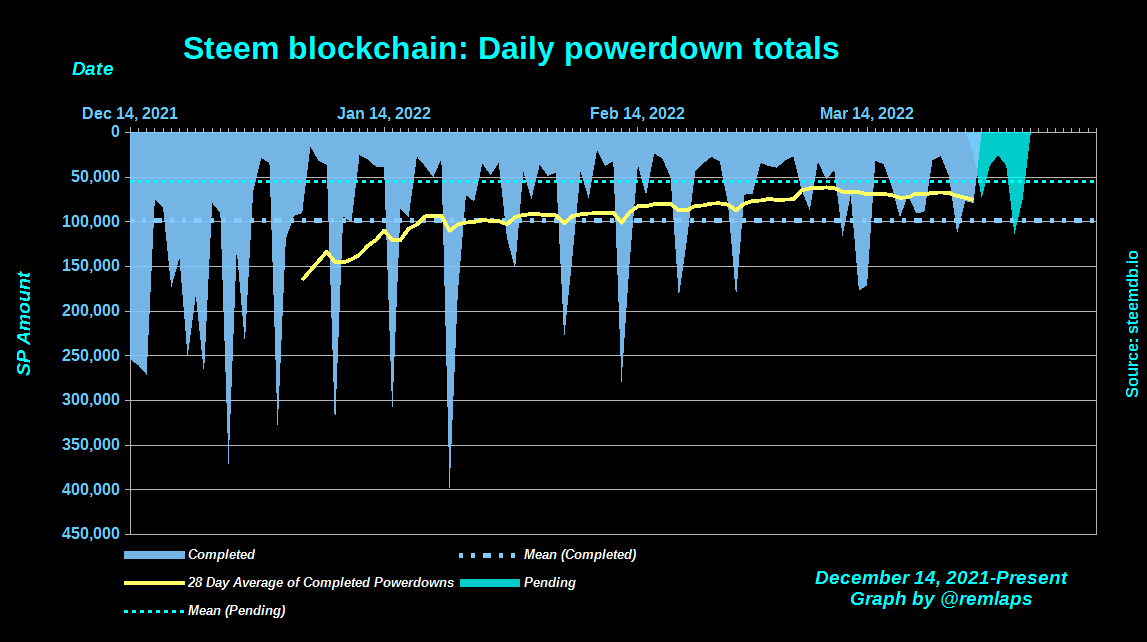
Daily Powerdown Activity
Here is graph with data from steemdb.io to show daily completed and pending powerdown activity. Overall, with about 477K powered down last week and 466K pending, we can expect weekly powerdowns to remain flat or decrease slightly. Incidentally, this is the first week that the overall average dropped below 100K.
The horizontal lines are the average values for completed (blue) and pending (cyan) powerdowns, and the yellow line is a 28 day moving average of completed powerdowns.
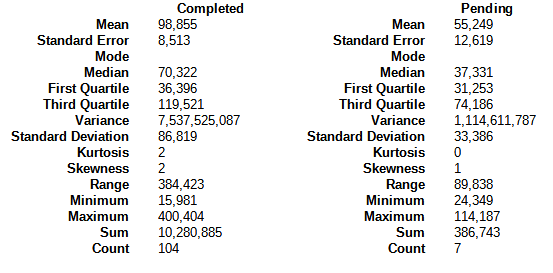
Here are some descriptive statistics for the numbers geeks:
Notes
- Reference prices for STEEM and other tokens are downloaded from coingecko.com
Previous posts
- Steem Total Value Powered Up - $67 million - January 2,
20212022 - Steem Total Value Powered Up - $57 million - January 9, 2022
- Steem Total Value Powered Up - $60 million - January 16, 2022
- Steem Total Value Powered Up - $43 million - January 23, 2022
- Steem Total Value Powered Up - $46 million - January 30, 2022
- Steem Total Value Powered Up - $54 million - February 6, 2022
- Steem Total Value Powered Up - $50 million - February 13, 2022
- Steem Total Value Powered Up - $46 million - February 20, 2022
- Steem Total Value Powered Up - $48 million - February 27, 2022
- Steem Total Value Powered Up - $47 million - March 6, 2022
- Steem Total Value Powered Up - $47 million - March 13, 2022
- Steem Total Value Powered Up - $51 million - March 20, 2022
- Steem Total Value Powered Up - $60 million - March 27, 2022
Comments