Steem Total Value Powered Up - $65 million - April 3, 2022
16 comments
This is next in my series of posts reviewing the amount and value of powered up STEEM on the Steem blockchain. For previous posts, see the end of this entry.
Noteworthy in the last week,
- Week over week, the number of powered up STEEM increased by 1.1 million, or just about 3/4%.
- The week saw 6 daily increases and 5 new highs in number of STEEM powered up..
- At 39.45%, yesterday was the highest observed day as a percentage of market capitalization.
- The modeled value of powered-up STEEM gained in strength against BTC, LTC, and TRX. It lost ground against SBD and ETH.
- The modeled value of powered-up STEEM gained by $5 million, or 9% against the USD.
I don't have full visibility of weekly powerdowns because the web site, steemdb.io, was down for a few days. At the moment, it seems to be back up and rebuilding its database.- Update: The steemdb.io database seeems to be caught up now. Last week's report showed 477K in completed powerdowns. This week it shows 561K, representing a weekly increase of 15%.
- In terms of USD and all comparison tokens, today's locked value is higher than the January 1, 2022 baseline.
- I added Mean value lines to nearly all graphs this week.
Here are the numbers as-of a few minutes ago:
Total value locked in powered-up STEEM (USD): $65,346,127.42
STEEM market cap $165,456,465.50
Locked value in terms of other tokens:
| token | price | locked value equivalent | Jan 1, 2022 | pct of Jan 1 baseline |
|---|---|---|---|---|
| tron | $0.07 | 899,341,142 | 809,173,538 | 111.14% |
| steem-dollars | $5.20 | 12,566,562 | 11,284,131 | 111.36% |
| bitcoin | $46,509.00 | 1,405 | 1,300 | 108.11% |
| ethereum | $3,499.75 | 18,671 | 16,501 | 113.15% |
| litecoin | $126.49 | 516,611 | 411,561 | 125.53% |
| steem | $0.42 | 155,700,569 | 142,930,214 | 108.93% |
| USD | $1.00 | 65,346,127 | 61,837,042 | 105.68% |
And here are the charts, based on data collected daily since April 10, 2021.
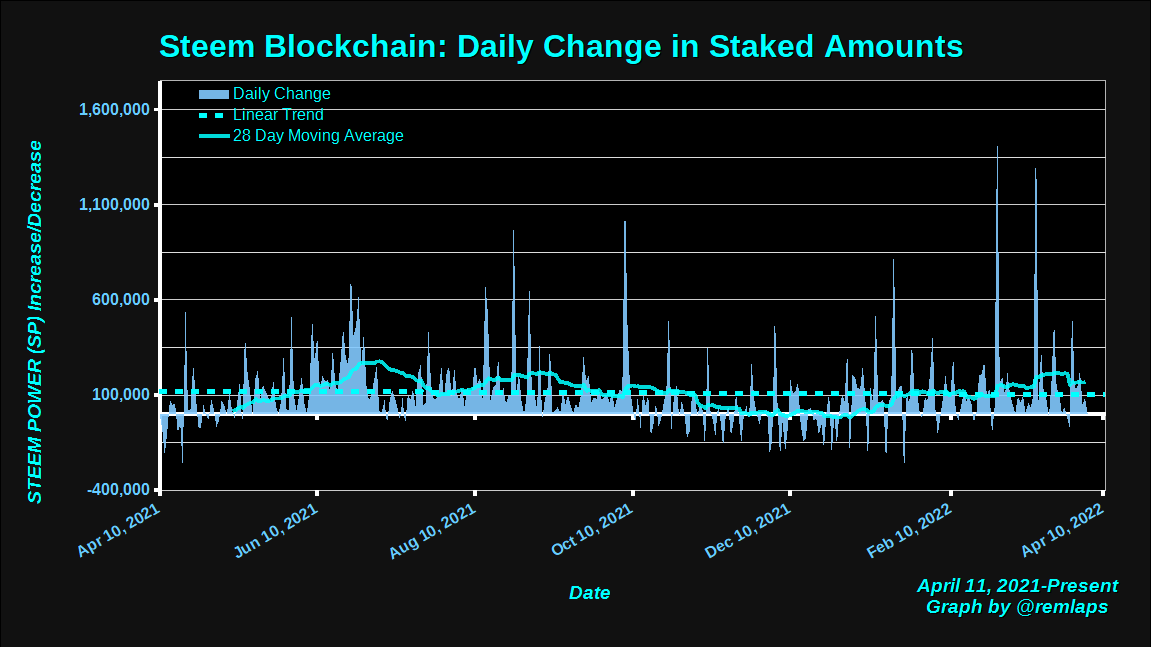
Daily Changes
Here is a chart of daily changes in powered-up STEEM from April 11, 2021 to present. The graph also includes a linear trend line and a 28 day moving average.
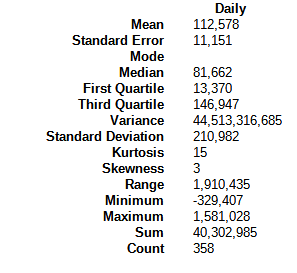
Here are some descriptive statistics, for numbers geeks.
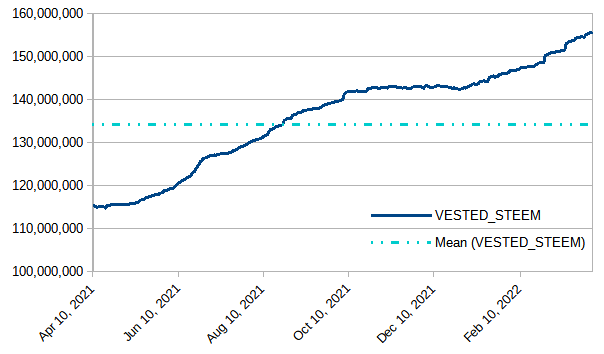
VESTED STEEM
With a weekly increase of about 1 million, this week saw six out of seven daily increases and also new highs each day from Tuesday through today. This is the thirteenth consecutive week with a clear upward slope.
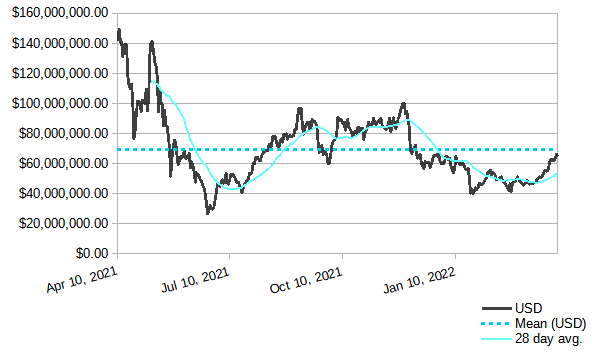
Modeled value of powered-up STEEM in terms of USD
In terms of USD, we saw a weekly increase of about $5 million, or 9%. The value remains above its summertime and more recent lows, and it's flirting with its long term mean (from April 11, 2021 when I started this series of reports).
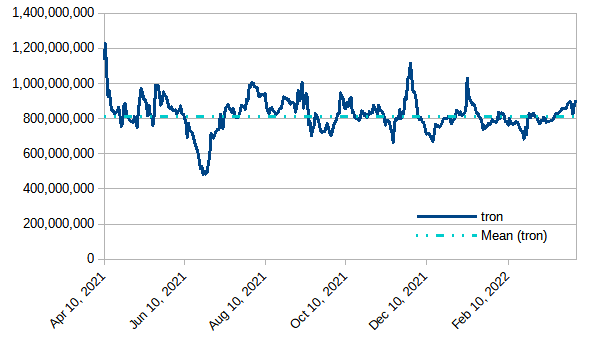
Modeled value of powered-up STEEM in terms of Tron (TRX)
Powered-up STEEM gained against TRX by about 19 million, or about 2%. This puts it almost dead-center in the previously common channel between 800 million and 1 billion.
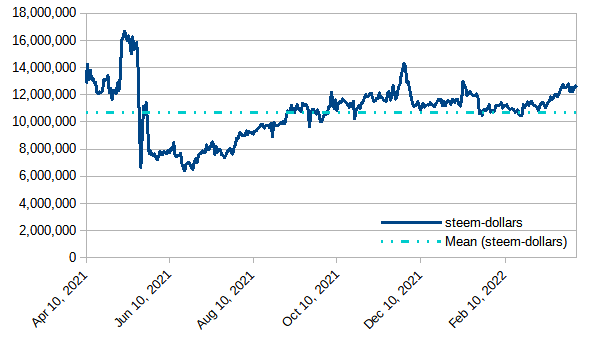
Modeled value of powered-up STEEM in terms of Steem Dollars
Down by about 110K, or a bit under 1%
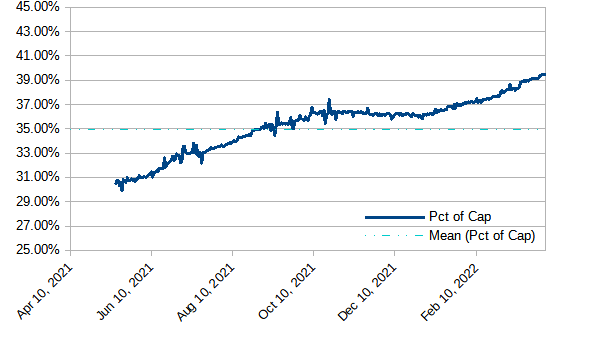
Modeled value of powered-up STEEM as a percentage of Steem's market cap
Gained ground again this week, climbing above 39% and reaching a new high at 39.45% yesterday (April 2). We have now seen 13 consecutive days above 39%; 32 consecutive days above 38%; 63 consecutive days above 37%; 190 consecutive days above 35%; and 253 straight days above 1/3. Also, the graph has started to reestablish an upward-seeming slope since the beginning of 2022. Will it hold above 39%? Will it go above 40%?
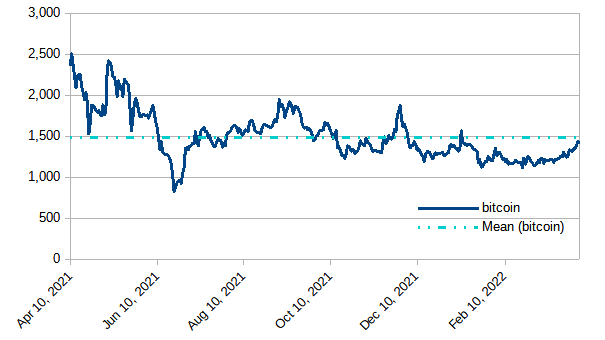
Modeled value of powered-up STEEM in terms of bitcoin (BTC)
Up by about 71 BTC, or 5% during the week. Now flirting with the 1,500 line for the first time since December.
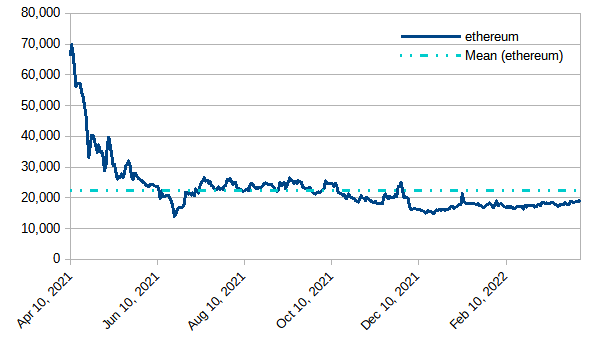
Modeled value of powered-up STEEM in terms of Ethereum
Down by about 173 ETH, or 1%. In the longer term, this has been approaching 20,000 ETH from below since December.
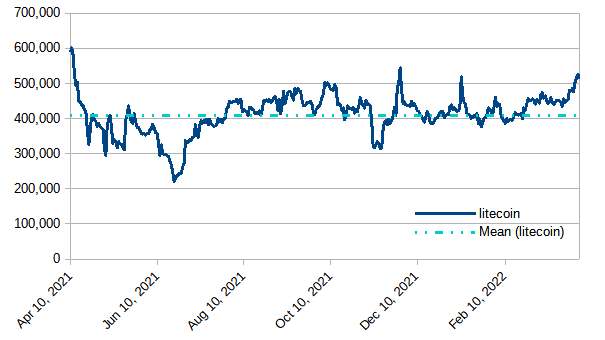
Modeled value of powered-up STEEM in terms of Litecoin
Powered-up STEEM gained by about 33,000 LTC, or about 7%. Still hanging around the 400k - 500k band, but taking a little jaunt above 500.
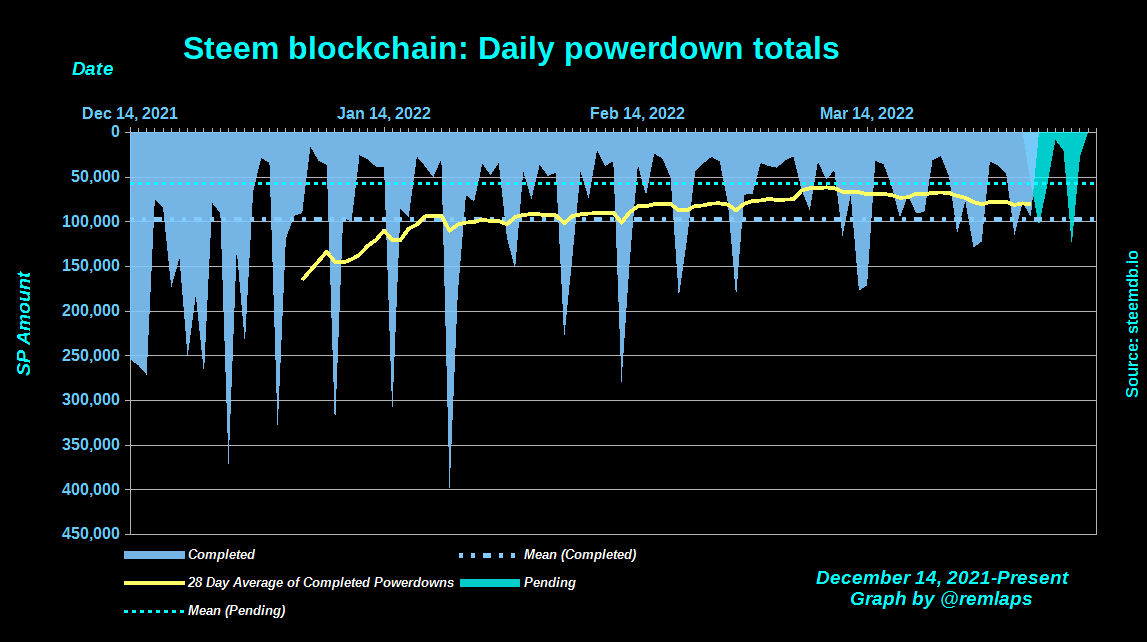
Daily Powerdown Activity
Here is graph with data from steemdb.io to show daily completed and pending powerdown activity. Overall, with about 561K powered down last week and 491K pending, we can expect weekly powerdowns to decrease by about 11% or more.
The horizontal lines are the average values for completed (blue) and pending (cyan) powerdowns, and the yellow line is a 28 day moving average of completed powerdowns. Numbers from April 2 and 3 are still missing while steemdb.io appears to be rebuilding its database.
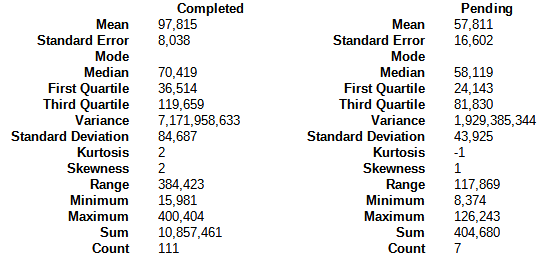
Here are some descriptive statistics for the numbers geeks:
Update: These numbers have now become available.
Notes
- Reference prices for STEEM and other tokens are downloaded from coingecko.com
Previous posts
- Steem Total Value Powered Up - $67 million - January 2,
20212022 - Steem Total Value Powered Up - $57 million - January 9, 2022
- Steem Total Value Powered Up - $60 million - January 16, 2022
- Steem Total Value Powered Up - $43 million - January 23, 2022
- Steem Total Value Powered Up - $46 million - January 30, 2022
- Steem Total Value Powered Up - $54 million - February 6, 2022
- Steem Total Value Powered Up - $50 million - February 13, 2022
- Steem Total Value Powered Up - $46 million - February 20, 2022
- Steem Total Value Powered Up - $48 million - February 27, 2022
- Steem Total Value Powered Up - $47 million - March 6, 2022
- Steem Total Value Powered Up - $47 million - March 13, 2022
- Steem Total Value Powered Up - $51 million - March 20, 2022
- Steem Total Value Powered Up - $60 million - March 27, 2022
- Steem Total Value Powered Up - $65 million - April 3, 2022
Comments