Steem Total Value Powered Up - $67 million - May 1, 2022
11 comments
This is next in my series of posts reviewing the amount and value of powered up STEEM on the Steem blockchain. For previous posts, see the end of this entry.
Noteworthy in the last week,
- Week over week, the number of powered up STEEM increased by 176K, or just about 1/10%.
- The week saw 6 daily increases and 5 new highs in number of STEEM powered up.
- At 41.61%, the series-long high as a percentage of market cap was recorded on April 26. All other observations were in the 39% range, so this was probably a fluke of timing in the way that CoinGecko updates their market cap and price fields.
- The modeled value of powered-up STEEM gained ground against all comparison tokens except TRX, ranging from 1.7% against BTC to 9.8% against the SBD.
- The modeled value of powered-up STEEM lost ground against the USD by less than 1%.
- Total power-downs this week totaled 653K STEEM, up slightly from last week's 636K.
- In terms of all comparison tokens, today's locked value is markedly higher than the January 1, 2022 baseline.
Here are the numbers as-of a few minutes ago:
Total value locked in powered-up STEEM (USD): $67,298,639.17
STEEM market cap $170,515,627.91
Locked value in terms of other tokens:
| token | price | locked value equivalent | Jan 1, 2022 | pct of Jan 1 baseline |
|---|---|---|---|---|
| tron | $0.07 | 986,566,578 | 809,173,538 | 121.92% |
| steem-dollars | $3.85 | 17,480,166 | 11,284,131 | 154.91% |
| bitcoin | $38,259.00 | 1,759 | 1,300 | 135.35% |
| ethereum | $2,807.60 | 23,970 | 16,501 | 145.27% |
| litecoin | $98.68 | 681,988 | 411,561 | 165.71% |
| steem | $0.43 | 156,618,096 | 142,930,214 | 109.58% |
| USD | $1.00 | 67,298,639 | 61,837,042 | 108.83% |
And here are the charts, based on data collected daily since April 10, 2021.
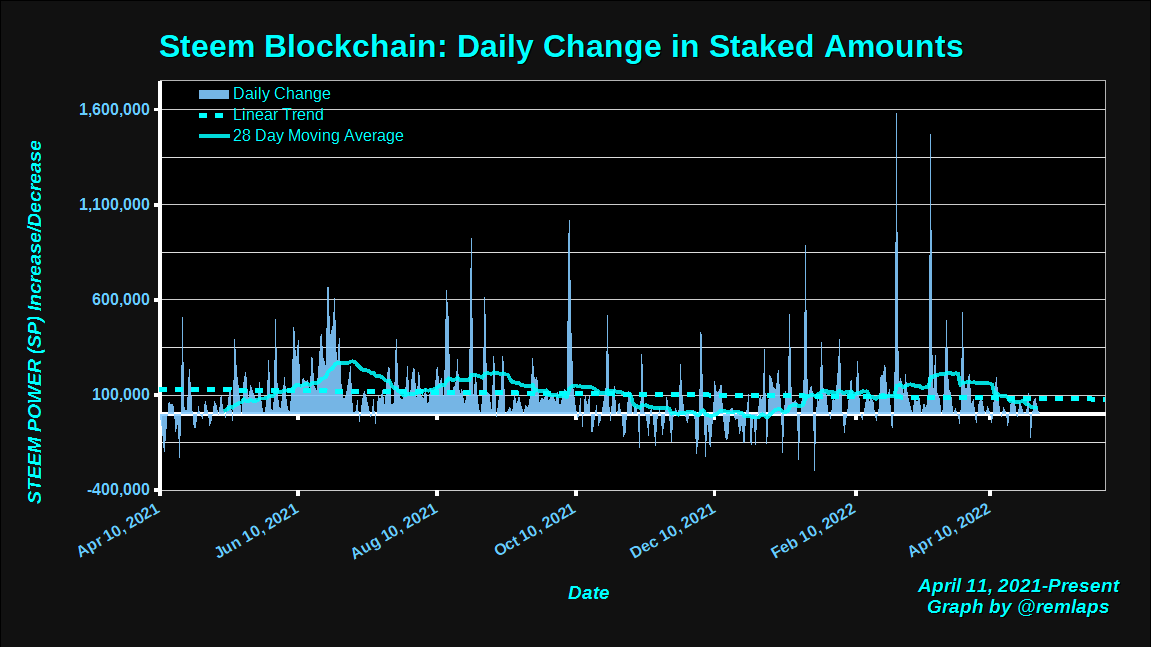
Daily Changes
Here is a chart of daily changes in powered-up STEEM from April 11, 2021 to present. The graph also includes a linear trend line and a 28 day moving average.
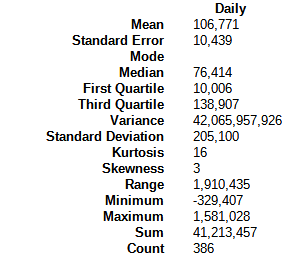
Here are some descriptive statistics, for numbers geeks.
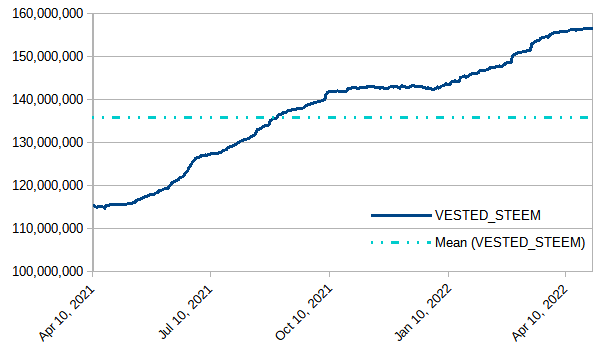
VESTED STEEM
With a weekly increase of about 176 thousand or 1/10%, this week saw six out of seven daily increases and also new highs on five days. The graph is continuing to run just a touch above flat.
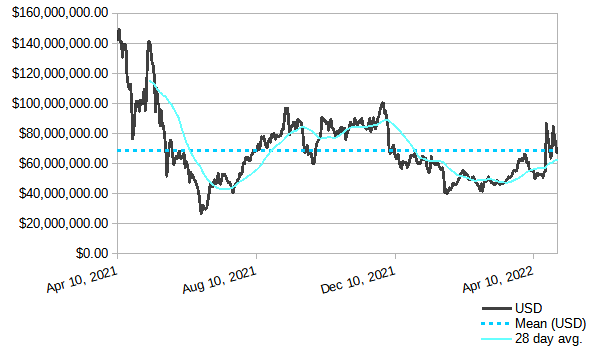
Modeled value of powered-up STEEM in terms of USD
In terms of USD, we saw a weekly decrease of about half-a-million dollars, or less than 1%. The value is presently near its series-long average value.
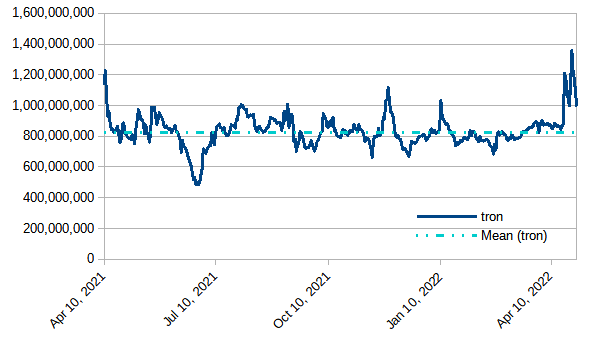
Modeled value of powered-up STEEM in terms of Tron (TRX)
After reaching a new high of 1,357,208,461 on April 27, the modeled value of powered-up STEEM lost value against TRX over the week by about 48 million, or 4 1/2%.
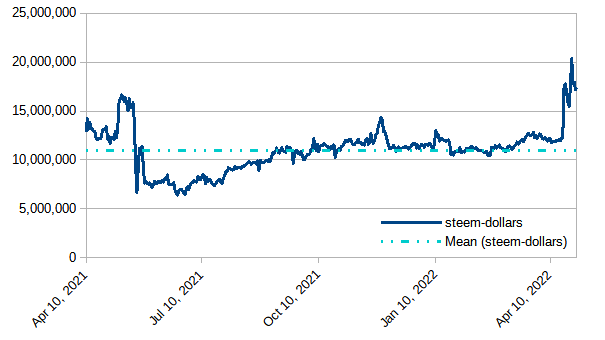
Modeled value of powered-up STEEM in terms of Steem Dollars
Up by a bit over 1.5 million or just shy of 10%
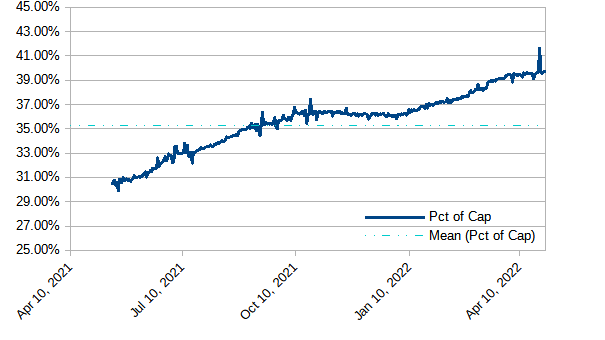
Modeled value of powered-up STEEM as a percentage of Steem's market cap
Running just slightly above flat for the last three weeks, with an anomalous jump up on April 27. We have now seen 27 consecutive days above 39%; 60 consecutive days above 38%; 91 consecutive days above 37%; 218 consecutive days above 35%; and 281 straight days above 1/3. After three months of upslope, the graph is now leveling off. Will it hold above 39%? Will it go above 40%?
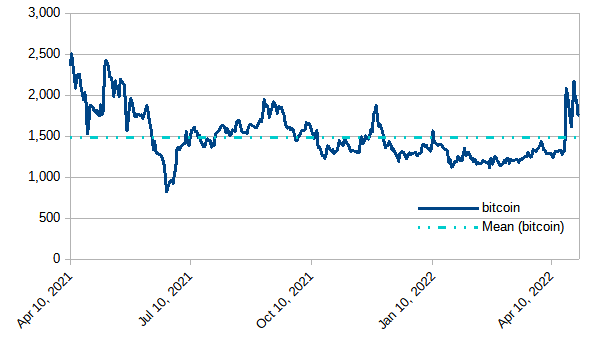
Modeled value of powered-up STEEM in terms of bitcoin (BTC)
Up by about 29 BTC, or 1.7% during the week.
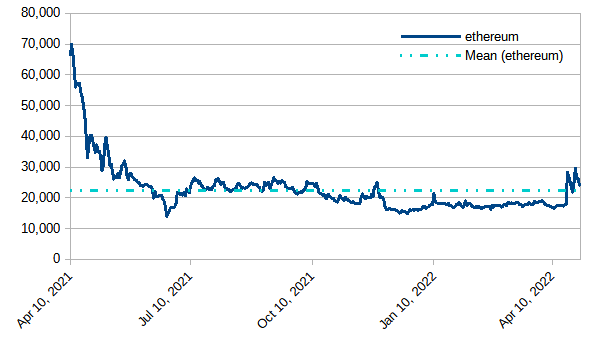
Modeled value of powered-up STEEM in terms of Ethereum
Up by about 800 ETH, or 3.4%.
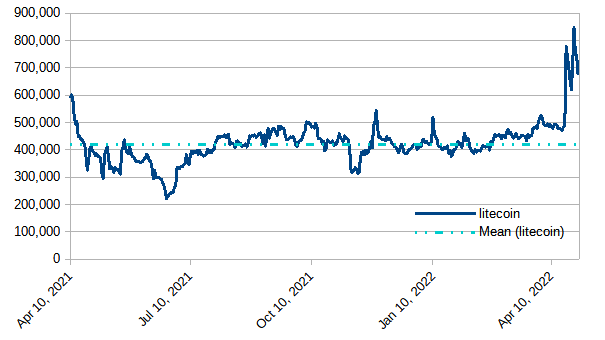
Modeled value of powered-up STEEM in terms of Litecoin
Powered-up STEEM increased by about 23,000 LTC, or about 3 1/2%. This is the eleventh consecutive day above the previous series-high near 600K. After reaching a new observed high of 846,828 on April 27, it settled back into the 600K-700K range.
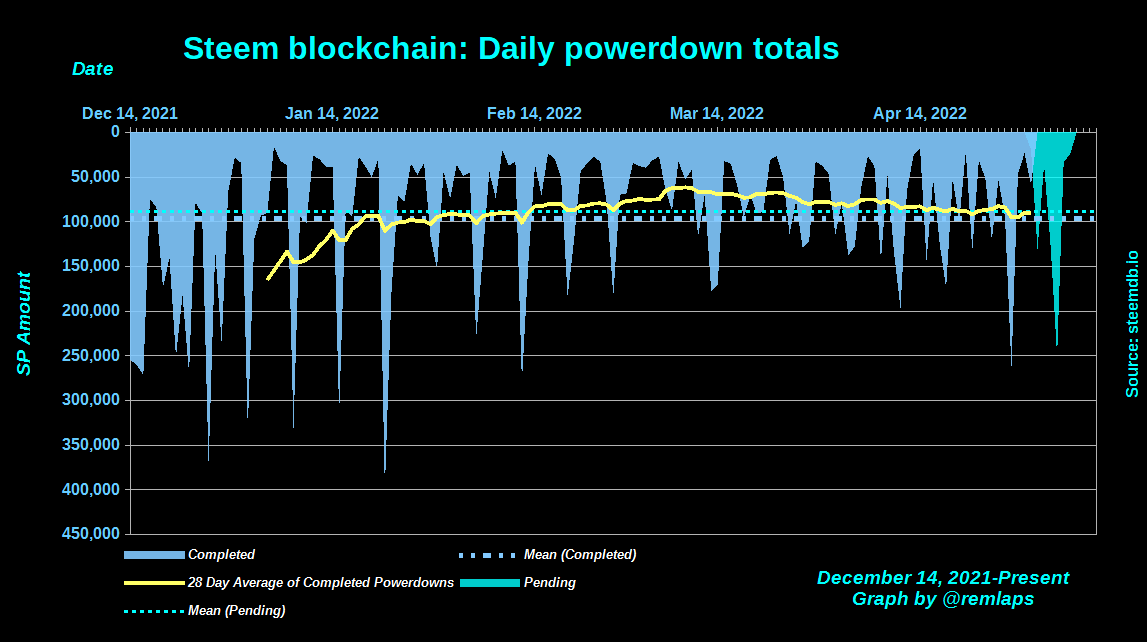
Daily Powerdown Activity
Here is graph with data from steemdb.io to show daily completed and pending powerdown activity. Overall, with about 653K powered down last week and 680K pending, we can expect weekly powerdowns to be basically flat, with a small percentage of increase. The big spike in pending powerdowns is exactly two weeks after the April 21 price pump. That spike represents more than 1/3 of this week's pending powerdowns.
The horizontal lines are the average values for completed (blue) and pending (cyan) powerdowns, and the yellow line is a 28 day moving average of completed powerdowns.
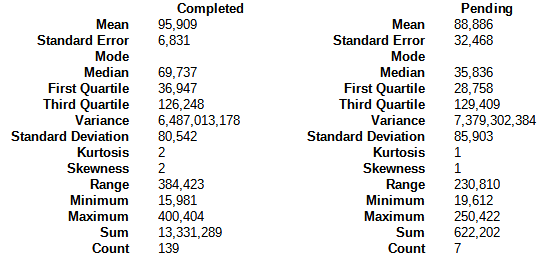
Here are some descriptive statistics for the numbers geeks:
Notes
- Reference prices for STEEM and other tokens are downloaded from coingecko.com
Previous posts
- Steem Total Value Powered Up - $67 million - January 2,
20212022 - Steem Total Value Powered Up - $57 million - January 9, 2022
- Steem Total Value Powered Up - $60 million - January 16, 2022
- Steem Total Value Powered Up - $43 million - January 23, 2022
- Steem Total Value Powered Up - $46 million - January 30, 2022
- Steem Total Value Powered Up - $54 million - February 6, 2022
- Steem Total Value Powered Up - $50 million - February 13, 2022
- Steem Total Value Powered Up - $46 million - February 20, 2022
- Steem Total Value Powered Up - $48 million - February 27, 2022
- Steem Total Value Powered Up - $47 million - March 6, 2022
- Steem Total Value Powered Up - $47 million - March 13, 2022
- Steem Total Value Powered Up - $51 million - March 20, 2022
- Steem Total Value Powered Up - $60 million - March 27, 2022
- Steem Total Value Powered Up - $65 million - April 3, 2022
- Steem Total Value Powered Up - $55 million - April 10, 2022
- Steem Total Value Powered Up - $68 million - April 24, 2022
- Steem Total Value Powered Up - $67 million - May 1, 2022
Comments