Steem Total Value Powered Up - $37 million - September 11, 2022
9 comments
This is next in my series of posts reviewing the amount and value of powered up STEEM on the Steem blockchain. For previous posts, see the end of this entry.
Noteworthy in the last week |
|---|
- Week over week, the number of powered up STEEM increased by about 300K, or 0.2% (for the 2nd week in a row)
- Over the course of the week, we saw seven daily increases and seven new highs, for a total of 10 consecutive days with new highs recorded.
- The modeled value gained ground against USD, SBD, and TRX. It lost ground against BTC, ETH, and LTC. Changes ranged from -7% against ETH to -+5 1/2 against USD.
- In terms of all comparison values except for TRX and USD, the modeled value remains above its January 1 baseline.
- This week (Sunday through Saturday) saw a total of 3332K STEEM powered down, which is an increase of 8% as compared to last week's 305K STEEM.
- This week saw the 28 day average of completed powerdowns drop to an all-time low (during the time I've been tracking)
Here are the numbers as-of a few minutes ago |
|---|
Total value locked in powered-up STEEM (USD): $37,285,156.96
STEEM market cap $93,116,639.32
Locked value in terms of other tokens:
| token | price | locked value equivalent | Jan 1, 2022 | pct of Jan 1 baseline |
|---|---|---|---|---|
| tron | $0.06 | 585,094,656 | 809,173,538 | 72.31% |
| steem-dollars | $2.80 | 13,316,127 | 11,284,131 | 118.01% |
| bitcoin | $21,588.00 | 1,727 | 1,300 | 132.88% |
| ethereum | $1,755.78 | 21,235 | 16,501 | 128.69% |
| litecoin | $62.64 | 595,229 | 411,561 | 144.63% |
| steem | $0.24 | 158,207,164 | 142,930,214 | 110.69% |
| USD | $1.00 | 37,285,157 | 61,837,042 | 60.30% |
|
|---|
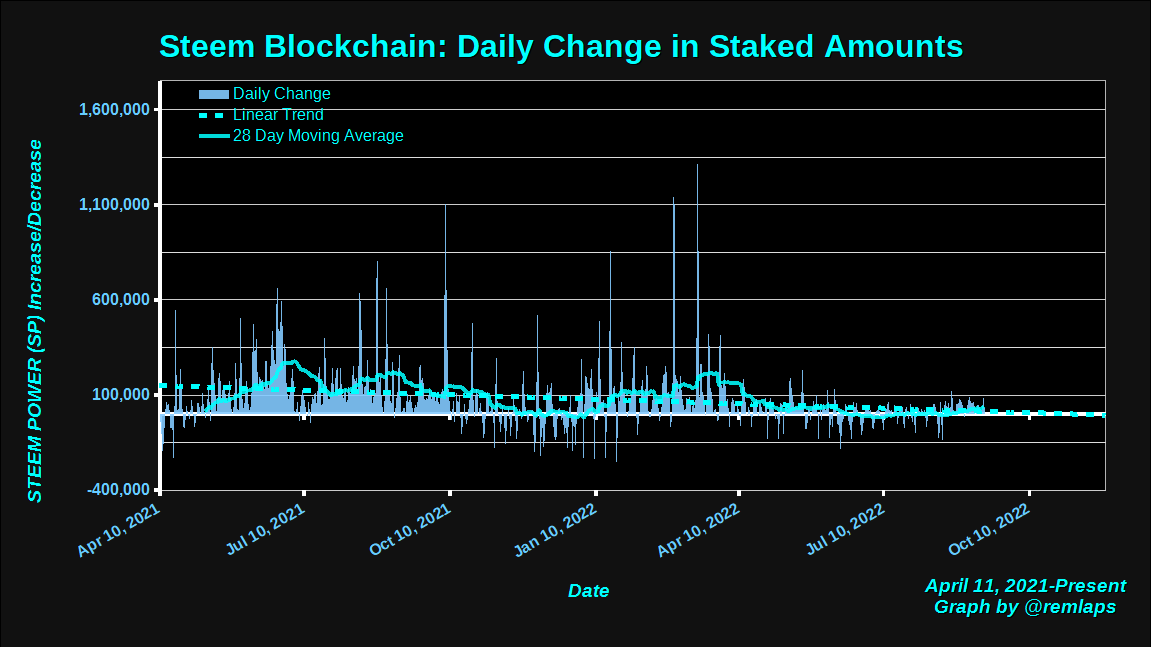
Daily Changes
Here is a chart of daily changes in powered-up STEEM from April 11, 2021 to present. The graph also includes a linear trend line and a 28 day moving average.
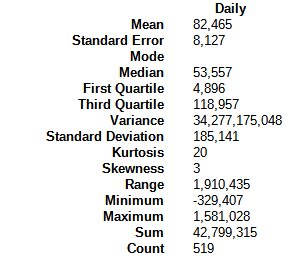
Here are some descriptive statistics, for numbers geeks.
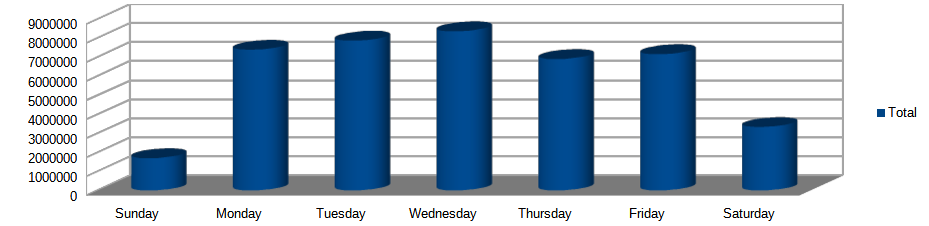
In case you're interested, which day of the week has seen the most increases since I started tracking? Wednesday.
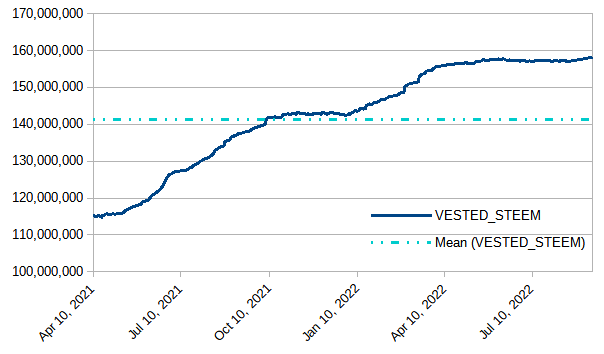
VESTED STEEM
With a weekly increase of about 300K, or 1/5%, the graph has a somewhat perceptible upslope, but remains basically flat for its 14th consecutive week.
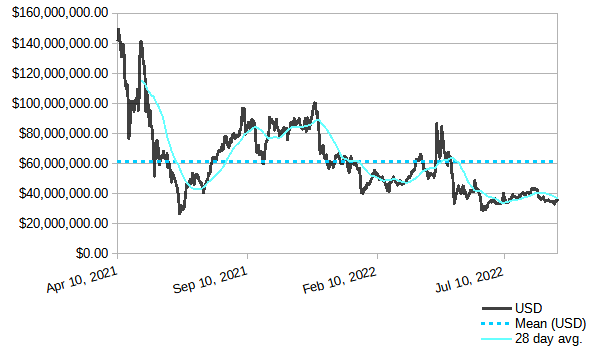
Modeled value of powered-up STEEM in terms of USD
In terms of USD, we saw a weekly increase of about 2 million dollars, or about 5 1/2%. The value is still below the long-term mean, and holds above its recent low near $34 million. It also remains above the low of ~27 million from June 22, 2021.
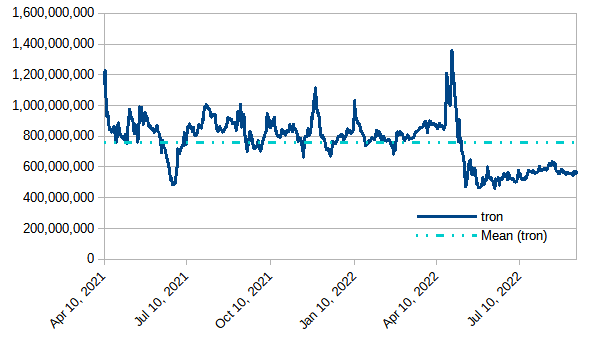
Modeled value of powered-up STEEM in terms of Tron (TRX)
Powered-up STEEM gained ground by about 21 million tokens against TRX or a little over 3.7%.
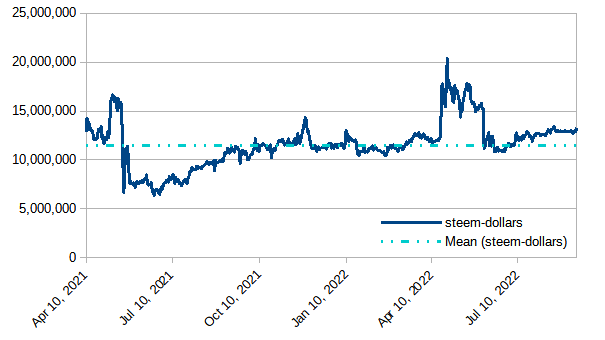
Modeled value of powered-up STEEM in terms of Steem Dollars
Up by about 371K SBDs or 2.9%
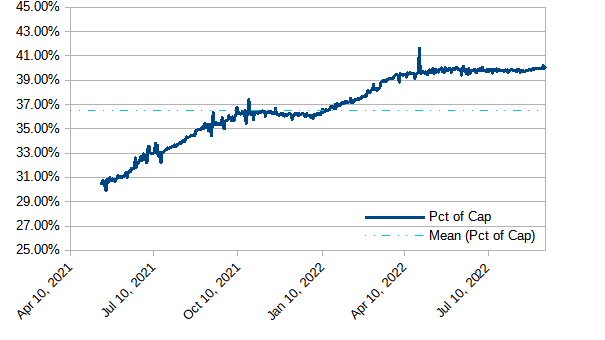
Modeled value of powered-up STEEM as a percentage of Steem's market cap
Still running basically flat for the last few months - aside from an anomalous spike on April 26. Flirted with the 40% all week, but didn't hold above there. With today's observed value of 39.94%, we have now seen 160 consecutive days above 39%; 193 consecutive days above 38%; 224 consecutive days above 37%; 351 consecutive days above 35%; and 414 straight days above 1/3. Will it climb back above 40%?
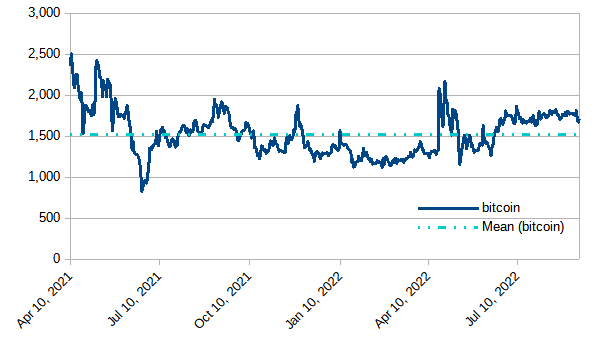
Modeled value of powered-up STEEM in terms of bitcoin (BTC)
Lost ground by about 65 BTC, or 3.66% during the week.
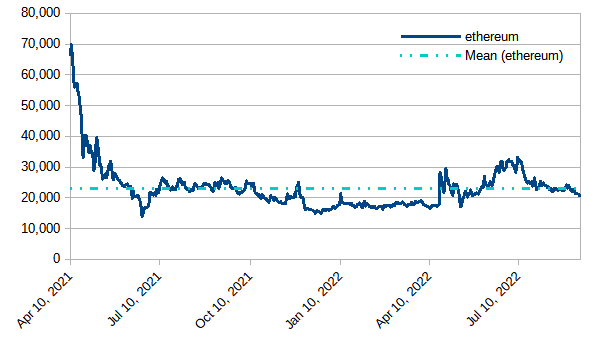
Modeled value of powered-up STEEM in terms of Ethereum
Powered-up STEEM lost ground by about 1,600 ETH, or about 7%.
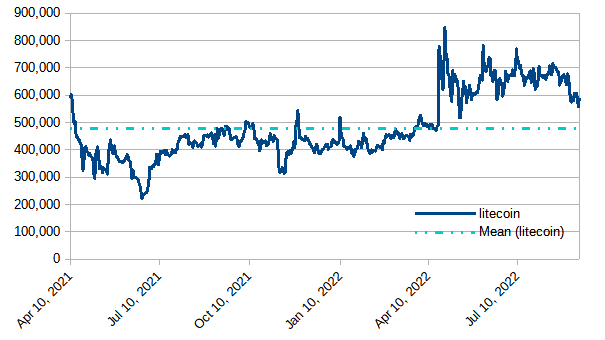
Modeled value of powered-up STEEM in terms of LTC
Down by about 2K, or 0.3%. Still running above the historical average, but might be reverting to the mean.
Daily Powerdown Activity
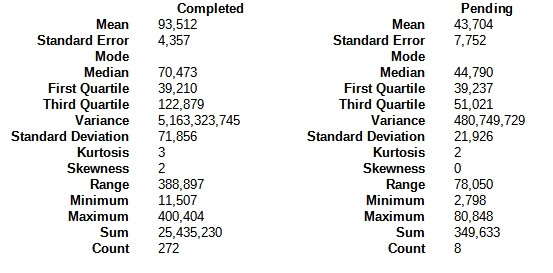
Here is graph with data from steemdb.io to show daily completed and pending powerdown activity. With 332K in completed powerdowns last week and 310K pending (both measured from Sunday through Saturday), we can expect powerdowns to decrease next week by about 6 1/2% or more. The 28 day average reached an all-time low since I began tracking last December.
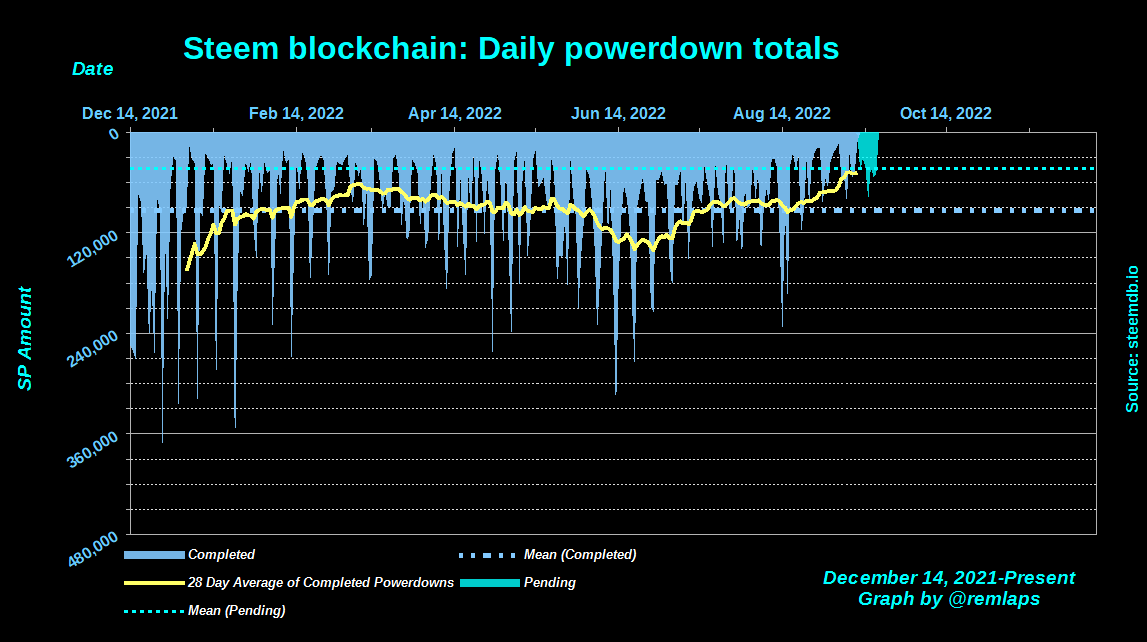
The horizontal lines are the average values for completed (blue) and pending (cyan) powerdowns, and the yellow line is a 28 day moving average of completed powerdowns. "Pending" numbers now come from the Steemit API, not from steemdb.io.
Here are some descriptive statistics for the numbers geeks:
| And with a total of 1126 pending power downs, here are the times, dates, and amounts of the top-10 |
|---|
1 2022-09-11T23:49:24 - 60,808,843 MVESTS, 33,770 STEEM
2 2022-09-16T04:37:51 - 47,577,243 MVESTS, 26,422 STEEM
3 2022-09-14T09:17:21 - 45,315,796 MVESTS, 25,166 STEEM
4 2022-09-17T14:07:09 - 40,113,363 MVESTS, 22,277 STEEM
5 2022-09-13T08:43:27 - 29,742,868 MVESTS, 16,517 STEEM
6 2022-09-14T08:39:27 - 23,031,953 MVESTS, 12,791 STEEM
7 2022-09-18T16:58:42 - 19,358,194 MVESTS, 10,750 STEEM
8 2022-09-16T06:17:18 - 18,010,963 MVESTS, 10,002 STEEM
9 2022-09-15T20:43:36 - 15,021,215 MVESTS, 8,342 STEEM
10 2022-09-17T08:51:18 - 13,743,935 MVESTS, 7,633 STEEM
Notes
- Reference prices for STEEM and other tokens are downloaded from coingecko.com
Previous posts
- Steem Total Value Powered Up - $34 million - July 3, 2022
- Steem Total Value Powered Up - $37 million - July 10, 2022
- Steem Total Value Powered Up - $36 million - July 17, 2022
- Steem Total Value Powered Up - $38 million - July 24, 2022
- Steem Total Value Powered Up - $41 million - July 31, 2022
- Steem Total Value Powered Up - $41 million - August 7, 2022
- Steem Total Value Powered Up - $43 million - August 14, 2022
- Steem Total Value Powered Up - $38 million - August 21, 2022
- Steem Total Value Powered Up - $36 million - August 28, 2022
- Steem Total Value Powered Up - $37 million - September 11, 2022
For links from 2021 and the first half of 2022, see these posts:
- Steem Total Value Powered Up - $67 million - January 2,
20212022 - Steem Total Value Powered Up - $36 million - June 26, 2022
- Steem Total Value Powered Up - $36 million - June 26, 2022

Pixabay license, source
Reminder
Visit the /promoted page and #burnsteem25 to support the inflation-fighters who are helping to enable decentralized regulation of Steem token supply growth.
Comments