Steem Total Value Powered Up - $34 million - July 3, 2022
10 comments
This is next in my series of posts reviewing the amount and value of powered up STEEM on the Steem blockchain. For previous posts, see the end of this entry.
| Noteworthy in the last week |
|---|
| BTC stayed in the summer doldrums this the week floating in the range near $19K through $21K. |
| Week over week, the number of powered up STEEM declined by about 52K, or about 0.03%. |
| Over the course of the week, we saw five daily increases and no new highs in number of STEEM powered up. |
| At 41.61%, the series-long high as a percentage of market cap was recorded on April 26. Nearly all subsequent observations have been in the 39% range, so this was probably a fluke of timing in the way that CoinGecko updates their market cap and price fields. |
| The modeled value of powered-up STEEM gained ground against all comparison values, except for TRX and USD. Changes ranged from -6% against USD and TRX to +9% against LTC. |
| Steemdb.io has not updated past June 30th, so I can't get weekly powerdown totals.. |
| In terms of all comparison values except for TRX, and USD, today's locked value is higher than the January 1, 2022 baseline. |
Here are the numbers as-of a few minutes ago:
Total value locked in powered-up STEEM (USD): $33,751,093.10
STEEM market cap $84,782,939.31
Locked value in terms of other tokens:
| token | price | locked value equivalent | Jan 1, 2022 | pct of Jan 1 baseline |
|---|---|---|---|---|
| tron | $0.06 | 520,882,355 | 809,173,538 | 64.37% |
| steem-dollars | $2.96 | 11,402,396 | 11,284,131 | 101.05% |
| bitcoin | $19,248.70 | 1,753 | 1,300 | 134.88% |
| ethereum | $1,060.62 | 31,822 | 16,501 | 192.85% |
| litecoin | $50.66 | 666,227 | 411,561 | 161.88% |
| steem | $0.21 | 157,168,237 | 142,930,214 | 109.96% |
| USD | $1.00 | 33,751,093 | 61,837,042 | 54.58% |
And here are the charts, based on data collected daily since April 10, 2021.
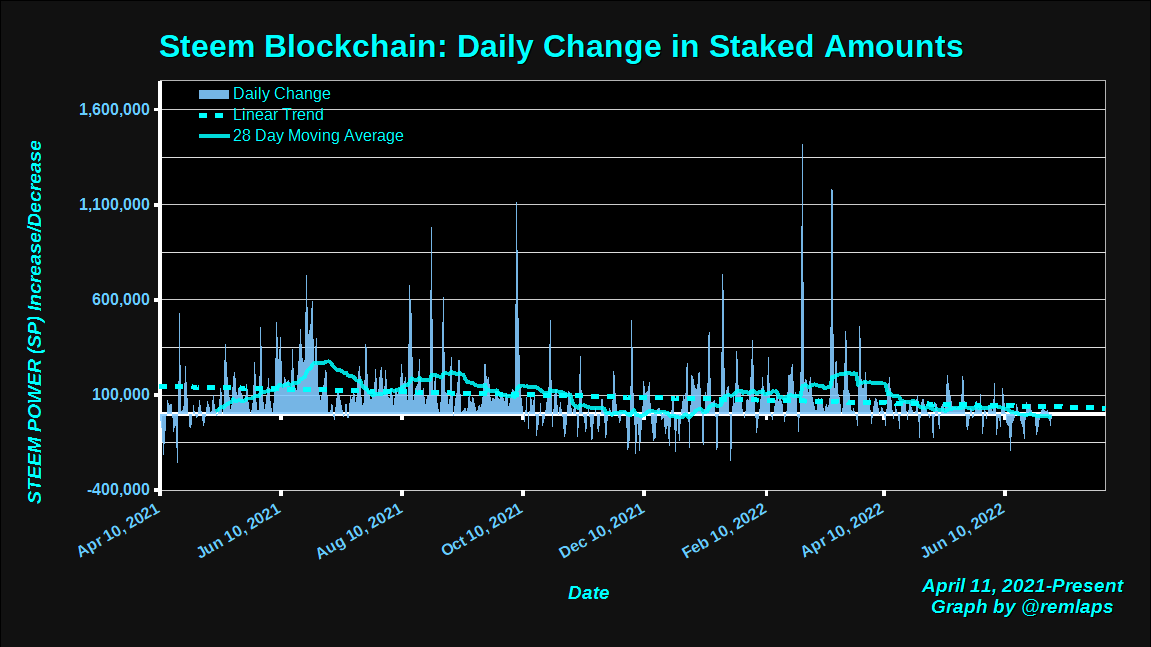
Daily Changes
Here is a chart of daily changes in powered-up STEEM from April 11, 2021 to present. The graph also includes a linear trend line and a 28 day moving average.
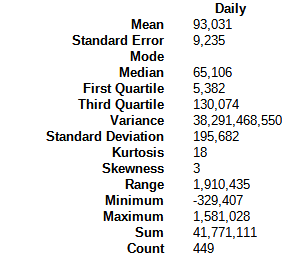
Here are some descriptive statistics, for numbers geeks.
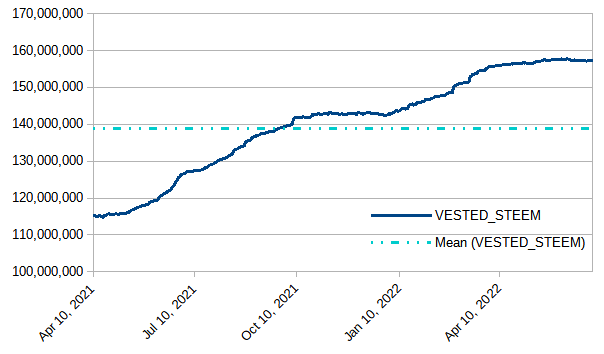
VESTED STEEM
With a weekly decline of about 52k, or 0.03%, the graph is basically flat, with a barely perceptible downslope for the last four weeks.
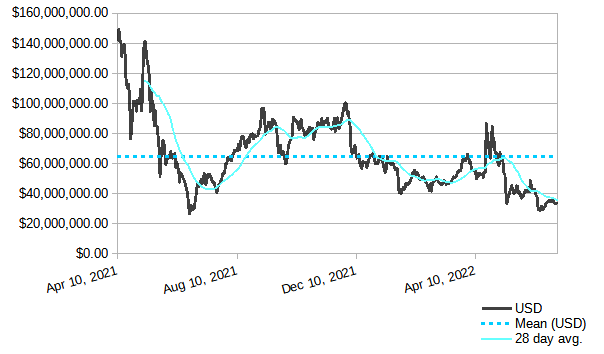
Modeled value of powered-up STEEM in terms of USD
In terms of USD, we saw a weekly decrease of a little more than 2 million dollars, or just over 6%. The value is still below the long-term mean, and just below its recent low around $34 million. It remains above the low of ~27 million from June 22, 2021.
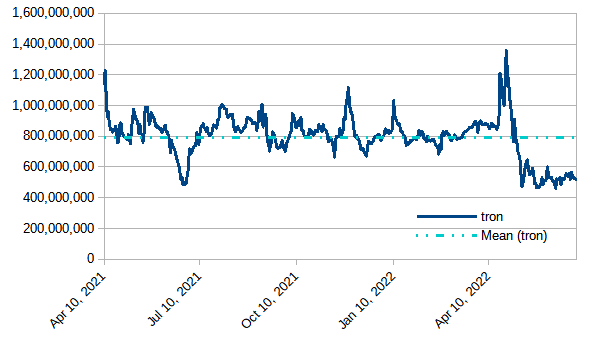
Modeled value of powered-up STEEM in terms of Tron (TRX)
TRX gained strength against powered-up STEEM by about 33 million TRX tokens or just over 6%.
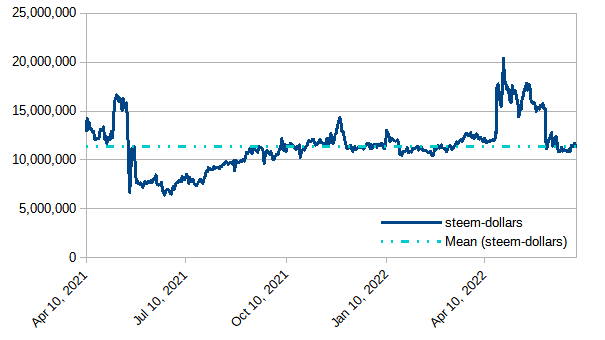
Modeled value of powered-up STEEM in terms of Steem Dollars
Up by about 283K tokens or just over 2 1/2%
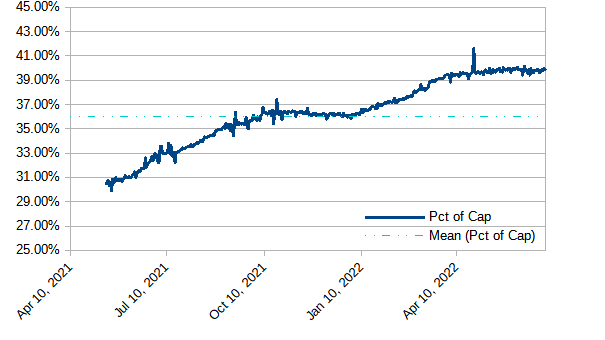
Modeled value of powered-up STEEM as a percentage of Steem's market cap
Still running basically flat for the last couple of months - aside from an anomalous spike on April 26. With today's observed value of 39.79%, we have now seen 90 consecutive days above 39%; 123 consecutive days above 38%; 154 consecutive days above 37%; 281 consecutive days above 35%; and 344 straight days above 1/3. Will it hold above 39%? Will it climb above 40%?
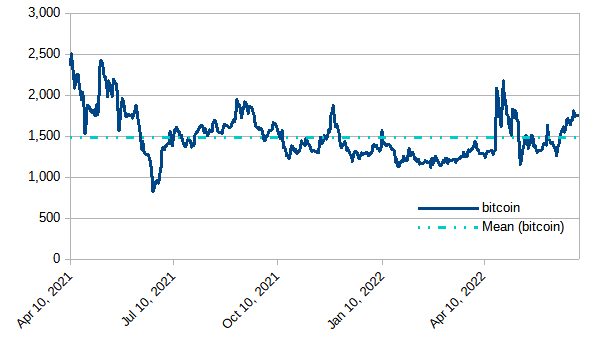
Modeled value of powered-up STEEM in terms of bitcoin (BTC)
Up by about 65 BTC, or almost 4% during the week.
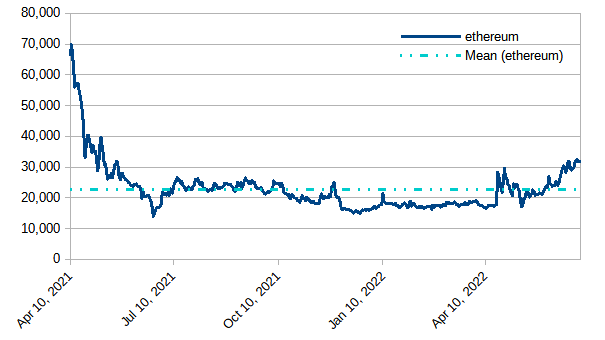
Modeled value of powered-up STEEM in terms of Ethereum
Up by about 2,400, or a bit over 8%. Currently running in the >30K range, which was last seen in May, 2021.
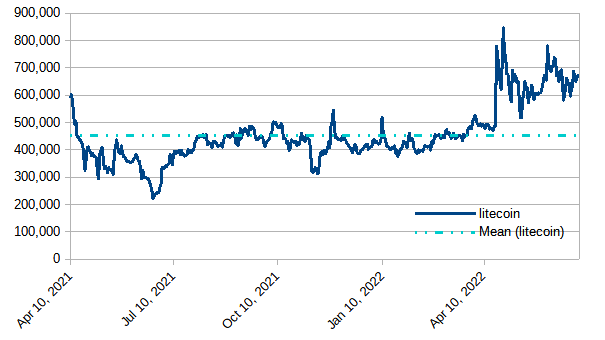
Modeled value of powered-up STEEM in terms of LTC
Up by about 56K, or just over 9%. Still running well above the historical average.
Daily Powerdown Activity
Here is graph with data from steemdb.io to show daily completed and pending powerdown activity. Since steemdb.io hasn't updated past June 30, the graph is incomplete, and weekly comparisons are not possible.
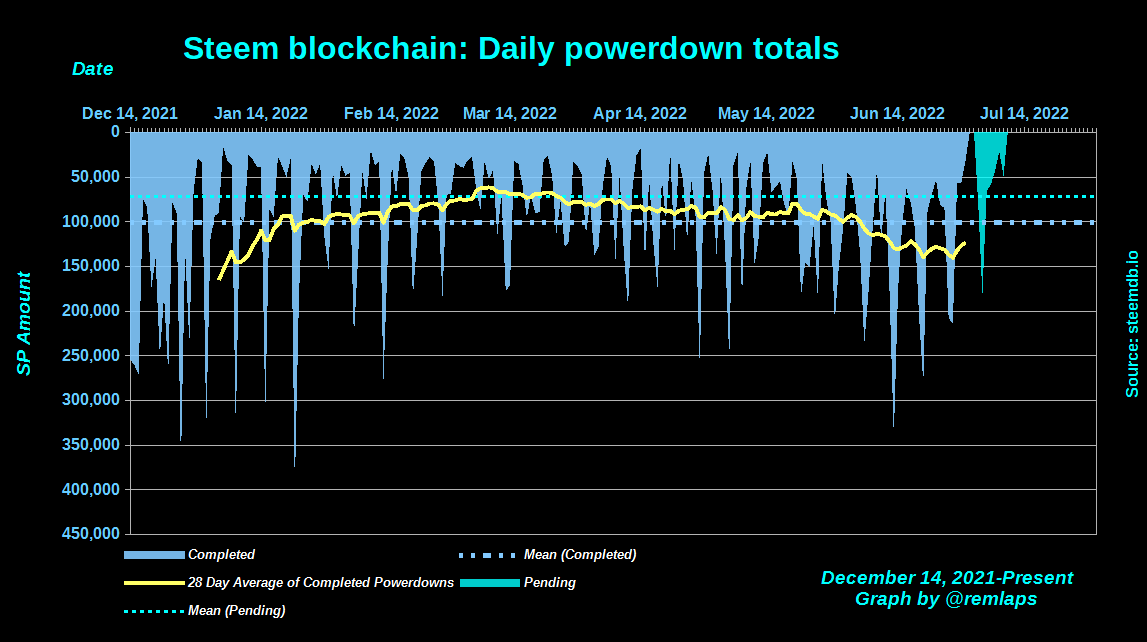
The horizontal lines are the average values for completed (blue) and pending (cyan) powerdowns, and the yellow line is a 28 day moving average of completed powerdowns.
Here are some descriptive statistics for the numbers geeks: This is also unavailable due to missing data on steemdb.io.
And with a total of 1,232 pending power downs, here are the times, dates, and amounts of the top-10:
1 2022-07-04T00:02:51 - 151,897,968 MVESTS, 83,858 STEEM
2 2022-07-10T16:03:48 - 114,198,731 MVESTS, 63,046 STEEM
3 2022-07-10T07:57:51 - 90,732,129 MVESTS, 50,091 STEEM
4 2022-07-08T19:18:42 - 78,046,257 MVESTS, 43,087 STEEM
5 2022-07-08T04:14:36 - 73,251,645 MVESTS, 40,440 STEEM
6 2022-07-09T03:59:51 - 48,437,273 MVESTS, 26,741 STEEM
7 2022-07-06T07:55:45 - 46,504,468 MVESTS, 25,674 STEEM
8 2022-07-05T19:28:03 - 45,781,126 MVESTS, 25,274 STEEM
9 2022-07-04T18:23:12 - 32,898,403 MVESTS, 18,162 STEEM
10 2022-07-04T16:56:39 - 22,281,554 MVESTS, 12,301 STEEM
Notes
- Reference prices for STEEM and other tokens are downloaded from coingecko.com
Previous posts
For links from 2021 and the first half of 2022, see these posts:
- Steem Total Value Powered Up - $67 million - January 2,
20212022 - Steem Total Value Powered Up - $36 million - June 26, 2022

Pixabay license, source
Reminder
Visit the /promoted page and #burnsteem25 to support the inflation-fighters who are helping to enable decentralized regulation of Steem token supply growth.
Comments