Steem Total Value Powered Up - $43 million - August 14, 2022
6 comments
This is next in my series of posts reviewing the amount and value of powered up STEEM on the Steem blockchain. For previous posts, see the end of this entry.
Noteworthy in the last week |
|---|
- Week over week, the number of powered up STEEM decreased by about 50K, or 0%.
- Over the course of the week, we saw four daily increases and no new highs in number of STEEM powered up.
- The modeled value of powered-up STEEM gained ground against all comparison values, except for BTC and ETH. Changes ranged from -8% against ETH to +4% against USD and TRX.
- In terms of all comparison values except for TRX, and USD, today's locked value is higher than the January 1, 2022 baseline.
- This week (Sunday through Saturday) saw a total of 478K STEEM powered down, which is a decrease of 14% as compared to last week's 560K STEEM.
Here are the numbers as-of a few minutes ago |
|---|
Total value locked in powered-up STEEM (USD): $42,982,720.26
STEEM market cap $107,920,082.85
Locked value in terms of other tokens:
| token | price | locked value equivalent | Jan 1, 2022 | pct of Jan 1 baseline |
|---|---|---|---|---|
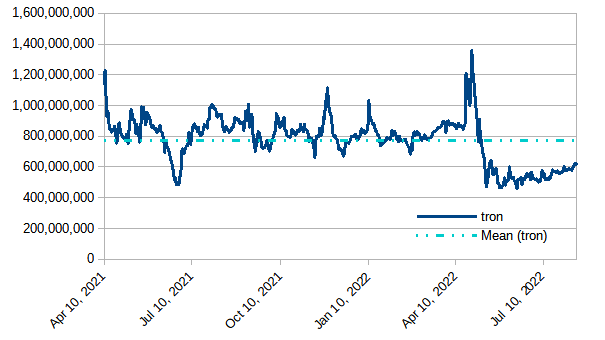
| tron | $0.07 | 609,683,975 | 809,173,538 | 75.35% |
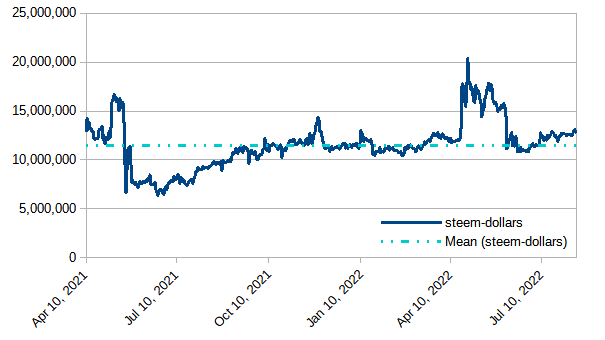
| steem-dollars | $3.36 | 12,792,476 | 11,284,131 | 113.37% |
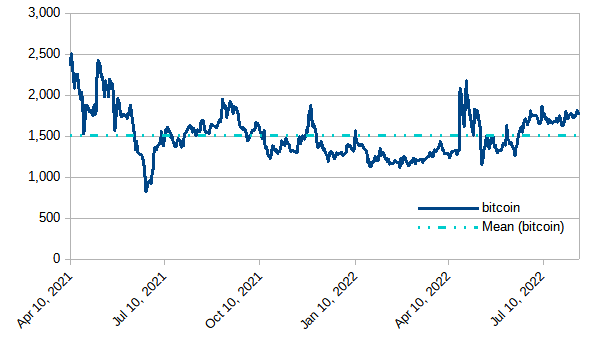
| bitcoin | $24,286.00 | 1,769 | 1,300 | 136.12% |
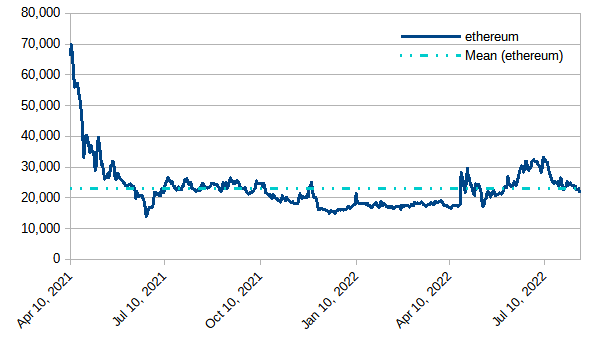
| ethereum | $1,924.44 | 22,335 | 16,501 | 135.36% |
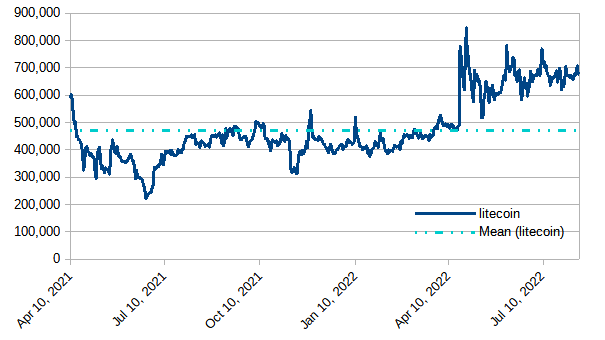
| litecoin | $63.35 | 678,495 | 411,561 | 164.86% |
| steem | $0.27 | 157,063,846 | 142,930,214 | 109.89% |
| USD | $1.00 | 42,982,720 | 61,837,042 | 69.51% |
|
|---|
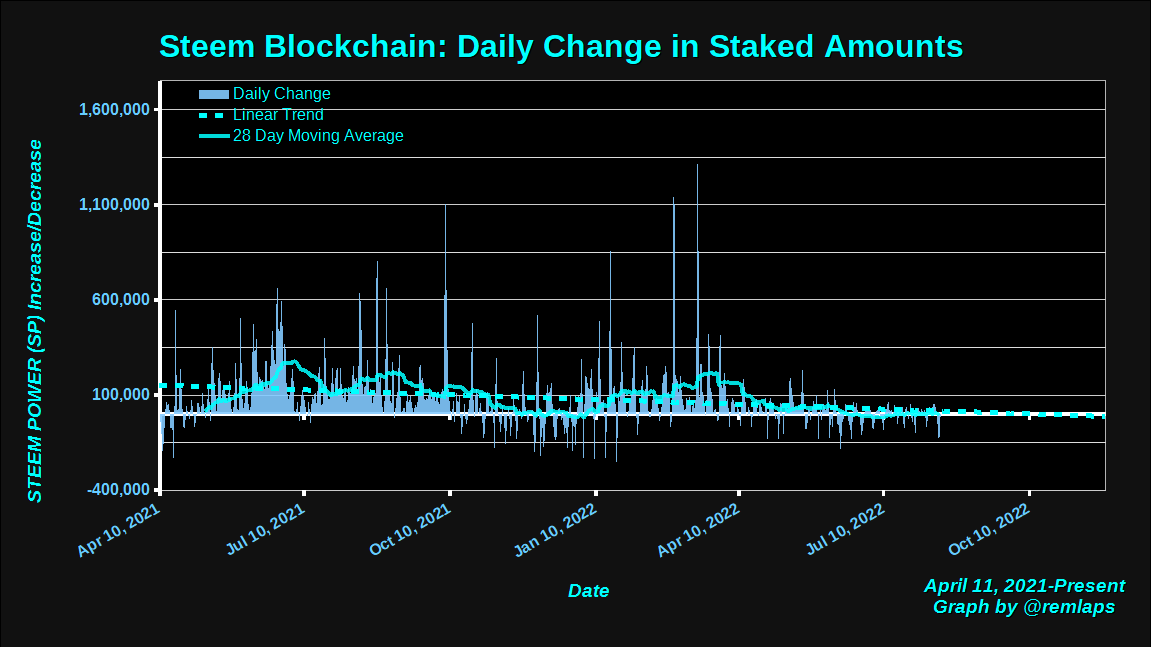
Daily Changes
Here is a chart of daily changes in powered-up STEEM from April 11, 2021 to present. The graph also includes a linear trend line and a 28 day moving average.
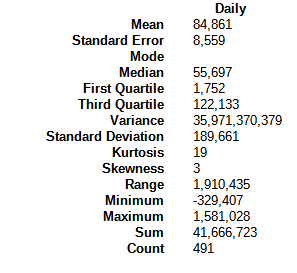
Here are some descriptive statistics, for numbers geeks.
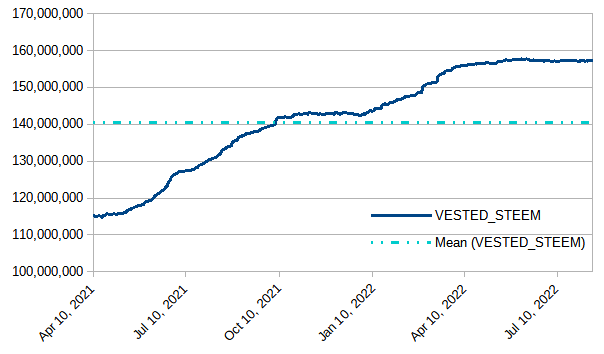
VESTED STEEM
With a weekly decline of about 50k, or 0%, the graph is basically flat for its 10th consecutive week.
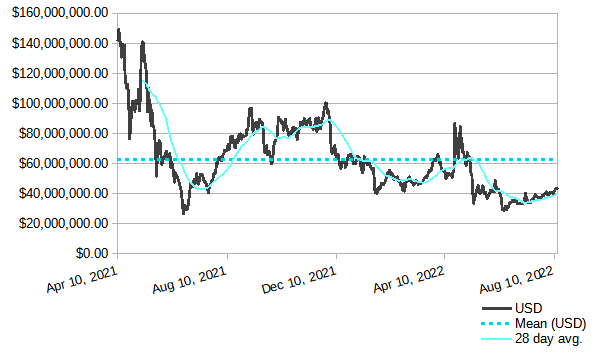
Modeled value of powered-up STEEM in terms of USD
In terms of USD, we saw a weekly increase of about 1.7M dollars, or about 4%. The value is still below the long-term mean, and holds above its recent low near $34 million. It also remains above the low of ~27 million from June 22, 2021.
Modeled value of powered-up STEEM in terms of Tron (TRX)
Powered-up STEEM continued a multi-month advance against TRX with a gain of almost 24 million TRX tokens or a little over 4%.
Modeled value of powered-up STEEM in terms of Steem Dollars
Up by about 167K SBDs or 1 3/10%
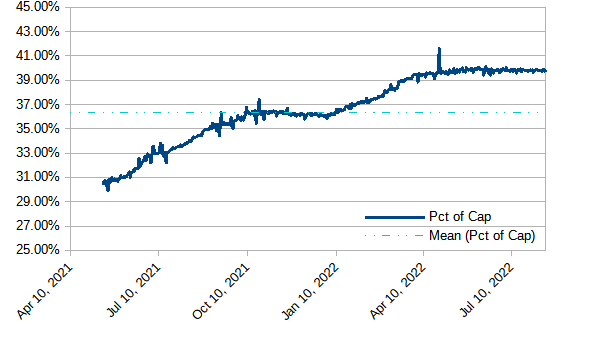
Modeled value of powered-up STEEM as a percentage of Steem's market cap
Still running basically flat for the last couple of months - aside from an anomalous spike on April 26. With today's observed value of 39.65%, we have now seen 132 consecutive days above 39%; 165 consecutive days above 38%; 196 consecutive days above 37%; 323 consecutive days above 35%; and 386 straight days above 1/3. Will it hold above 39%? Will it climb above 40%?
Modeled value of powered-up STEEM in terms of bitcoin (BTC)
Lost ground by about 6 BTC, or a bit over 1/3% during the week.
Modeled value of powered-up STEEM in terms of Ethereum
Powered-up STEEM declined by 2K ETH, or about 8%.
Modeled value of powered-up STEEM in terms of LTC
Up by about 8K, or 1 1/4%. Still running well above the historical average.
Daily Powerdown Activity
Here is graph with data from steemdb.io to show daily completed and pending powerdown activity. With 478K in completed powerdowns last week and 673K pending (both measured from Sunday through Saturday), we can expect powerdowns to increase next week by about 41% or less. As a technical matter, 1/3 of that "Pending" amount includes 237K in completed & pending powerdowns from today, Sunday, August 14. After today, the trend drops substantially.
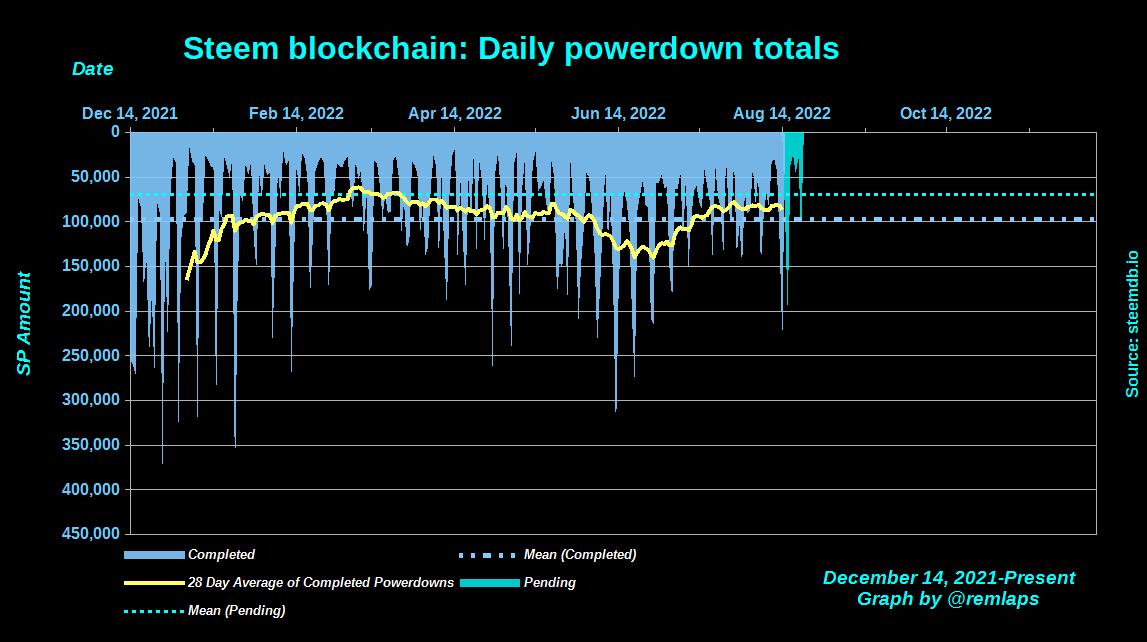
The horizontal lines are the average values for completed (blue) and pending (cyan) powerdowns, and the yellow line is a 28 day moving average of completed powerdowns.
As noted last week, the "pending powerdown"number is coming from the Steemit API now, not from steemdb.io, because steemdb.io seems to be underreporting by a substantial margin. A side-effect from this change is that we can now see ahead into the 8th day.
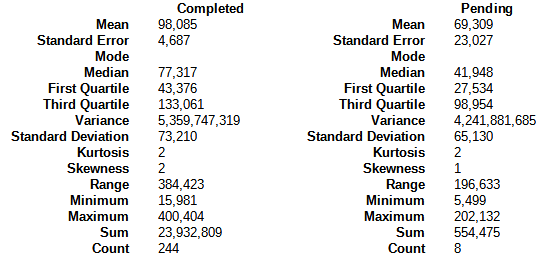
Here are some descriptive statistics for the numbers geeks:
And with a total of 1006 pending power downs, here are the times, dates, and amounts of the top-10:
1 2022-08-16T08:05:51 - 216,939,317 MVESTS, 120,190 STEEM
2 2022-08-21T16:01:21 - 159,032,138 MVESTS, 88,108 STEEM
3 2022-08-16T06:42:48 - 79,143,661 MVESTS, 43,848 STEEM
4 2022-08-15T23:12:24 - 58,689,804 MVESTS, 32,516 STEEM
5 2022-08-19T05:27:54 - 36,170,961 MVESTS, 20,040 STEEM
6 2022-08-15T20:46:30 - 30,265,957 MVESTS, 16,768 STEEM
7 2022-08-15T14:20:15 - 15,459,444 MVESTS, 8,565 STEEM
8 2022-08-16T19:47:33 - 13,397,689 MVESTS, 7,423 STEEM
9 2022-08-20T09:13:36 - 12,251,304 MVESTS, 6,788 STEEM
10 2022-08-15T04:55:06 - 9,801,136 MVESTS, 5,430 STEEM
Notes
- Reference prices for STEEM and other tokens are downloaded from coingecko.com
Previous posts
- Steem Total Value Powered Up - $34 million - July 3, 2022
- Steem Total Value Powered Up - $37 million - July 10, 2022
- Steem Total Value Powered Up - $36 million - July 17, 2022
- Steem Total Value Powered Up - $38 million - July 24, 2022
- Steem Total Value Powered Up - $41 million - July 31, 2022
- Steem Total Value Powered Up - $41 million - August 7, 2022
- Steem Total Value Powered Up - $43 million - August 14, 2022
For links from 2021 and the first half of 2022, see these posts:
- Steem Total Value Powered Up - $67 million - January 2,
20212022 - Steem Total Value Powered Up - $36 million - June 26, 2022

Pixabay license, source
Reminder
Visit the /promoted page and #burnsteem25 to support the inflation-fighters who are helping to enable decentralized regulation of Steem token supply growth.
Comments