Fibonacci Analysis
2 comments
Basic Concept
Fibonacci analysis is based on the Fibonacci sequence, a series of numbers where each number is the sum of the two preceding ones, typically starting with 0 and 1 (e.g., 0, 1, 1, 2, 3, 5, 8, 13, 21, …).
In technical analysis, Fibonacci ratios—most commonly 23.6%, 38.2%, 50%, 61.8%, and 100%—are derived from mathematical relationships between numbers in this sequence. These ratios are used to identify potential reversal levels on price charts.
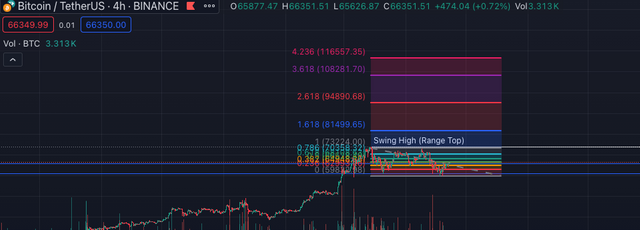
Fibonacci Retracement
How to Apply
In trading, Fibonacci retracement levels are drawn by taking two extreme points (usually a major peak and trough) on a stock chart and dividing the vertical distance by the key Fibonacci ratios. The resulting levels are interpreted as potential levels at which the price might reverse.
Similarly, Fibonacci extensions and Fibonacci fans are used to anticipate where prices might go following a retracement.
Useful Cases in Crypto and Stock
- Trend Reversals: Traders use Fibonacci retracement levels to spot potential reversals, support, or resistance areas which might indicate an entry or exit point.
- Price Targets: After a significant price movement, traders apply Fibonacci levels to predict where the price might find support or resistance in the future.
- Stop Loss Placement: Fibonacci can help in placing stop-loss orders effectively by identifying potential levels of support or resistance.
Strengths
- Wide Acceptance: Many traders use Fibonacci levels, which can become self-fulfilling due to collective attention.
- Flexibility: Applicable in different markets and across various time frames.
- Complements Other Methods: Works well when combined with other forms of technical analysis, enhancing decision-making.
Weaknesses
- Subjectivity: The choice of swing highs and lows for drawing Fibonacci levels can be subjective. Different traders might choose different points, leading to varying results.
- No Guarantees: Like all trading tools, Fibonacci retracement levels are not foolproof and do not guarantee successful predictions.
- Over-Reliance: Sole dependence on Fibonacci levels without consideration of market fundamentals or other technical indicators can lead to flawed trading decisions.
Enhancing Fibonacci Analysis
Combine with Other Indicators: To make Fibonacci analysis more robust, it is often combined with other technical indicators like moving averages, RSI (Relative Strength Index), and MACD (Moving Average Convergence Divergence).
For example, a Fibonacci retracement level that coincides with the 200-day moving average may provide a stronger level of support or resistance.
Incorporate Volume Data: Combining Fibonacci levels with volume indicators can validate the strength of price levels. High trading volume at a Fibonacci retracement level may reinforce the significance of that level.
Use with Candlestick Patterns: Identifying candlestick patterns around Fibonacci levels can provide additional clues about potential market movements.
By integrating Fibonacci analysis with other trading tools and being mindful of its limitations, traders can enhance their understanding of market dynamics and improve their trading strategies. This method remains a popular choice among traders for its mathematical rationality and historical effectiveness in both stock and cryptocurrency markets.
Harry Potter Library (HPL) Community
Please join the HPL community. You will get upvotes for your posts. Simply join and post there using the tags "hpl" or "harrypotterlibrary" in your post.
- Community Address: https://steemit.com/trending/hive-140602
- About HPL Community:
EN: Harry Potter Library - HPL
KR: [해리포터의 도서관 (Harry Potter Library, HPL)](https://steemit.com/hive-140602/@harryji/ab7uv-harry-potter-library-hpl
Comments