Moving Charts: BTC Value Per Coin Analysis | 10% To @tron-fan-club
4 comments
Hello everyone and welcome to everyone at Tron Fan Club. To our delight, the market has seen some positive signs over the past few weeks. Throughout the market, there have been uptrends. But a correction and some consolidation became inevitable. And it is no different for BTC as well. So, we saw BTC fluctuate a lot under the strong resistance zone. Today we will look at the price movements of BTC and reflect on where it could go next.

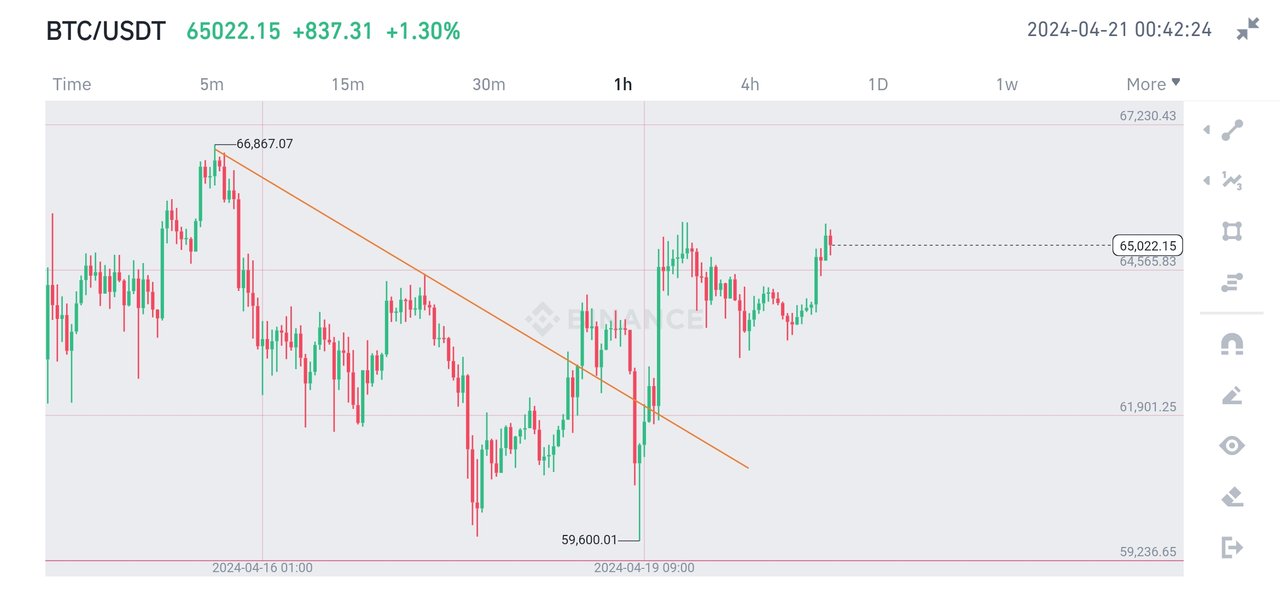
Last week, the King of Cryptocurrencies, BTC was hovering around 67000$ level. BTC was on uptrend for weeks. But these last few weeks were a bit different. These were the weeks of correction. BTC made swift moves and even came down to 59600$ before bouncing back. This week started with BTC losing the strong support zone of 61900$.
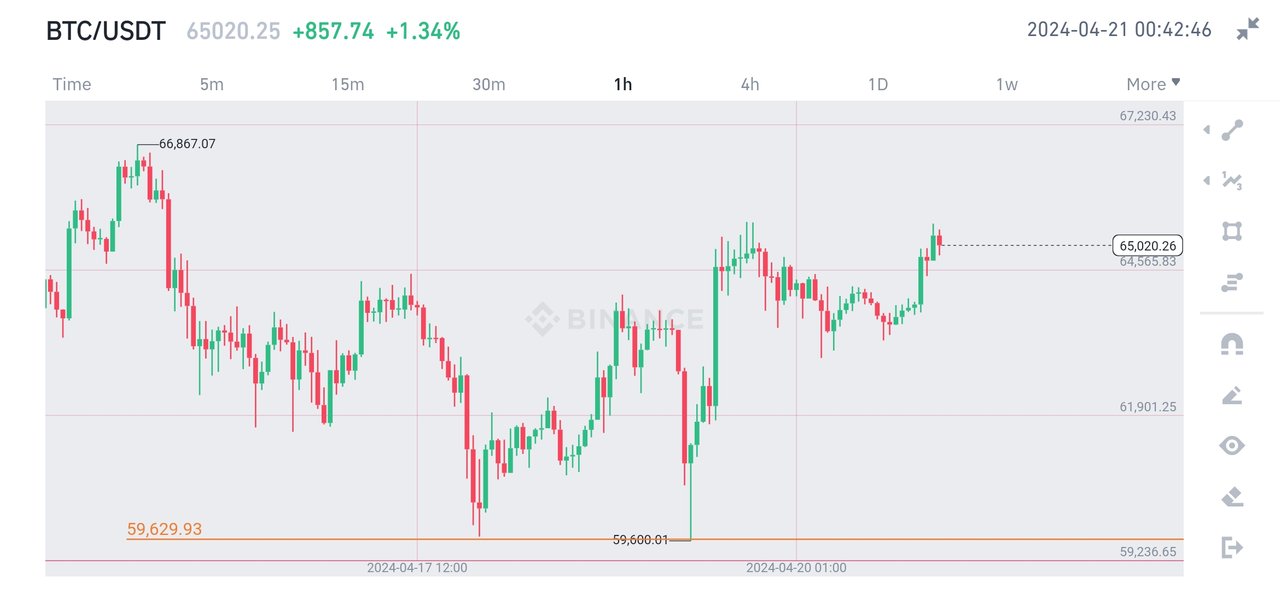
After losing the support, BTC fell quickly and came down to 59600$. However, bounced back in an instant. After the bounce at the 59600$ zone, BTC went up to the 63800$ level. Over the week, BTC created a bearish trendline. After bouncing back again at the support level, it eventually broke through the trendline. Currently, it clear that BTC needs to hold onto the support level of 59600$ zone and break-through 65200$ level. It is now at 65000$. This is ultimately a 3% lose in value over a time span of seven days.
All Screenshots are taken from Coingecko
No words from this article should be taken as financial advice.
Thank You for reading.
VOTE @bangla.witness as witness

OR

Comments