Topdown Analysis Of DOGEUSDT Using Support And Resistance Strategy And RSI Indicator As A Confluence
2 comments
Hello great minds,
It is another great day and I feel honored to come before you all today to share my analysis on Dogeusdt.
I believe you are doing perfectly fine and are enjoying your activities in the community as you actively promote steemit across various social media platform.
Doge coin is not an unpopular cryptocurrency in the cryptospace, it is known to be a meme coin influenced by Elon musk.
I decided to take an analysis on Doge coin today, please tag along.
ANALYSIS USING SUPPORT AND RESISTANCE STRATEGY
My analysis using support and resistance strategy often start from the higher timeframe to the lower timeframe.
On the higher timeframe, my aim is to detect the overall market trend, to check if the market is bearish or bullish overall, as this will play a crucial role in affecting my trading decisions.
And also the monthly timeframe, filters out noise from the chart and this will enable traders to make a more informed trading decision.
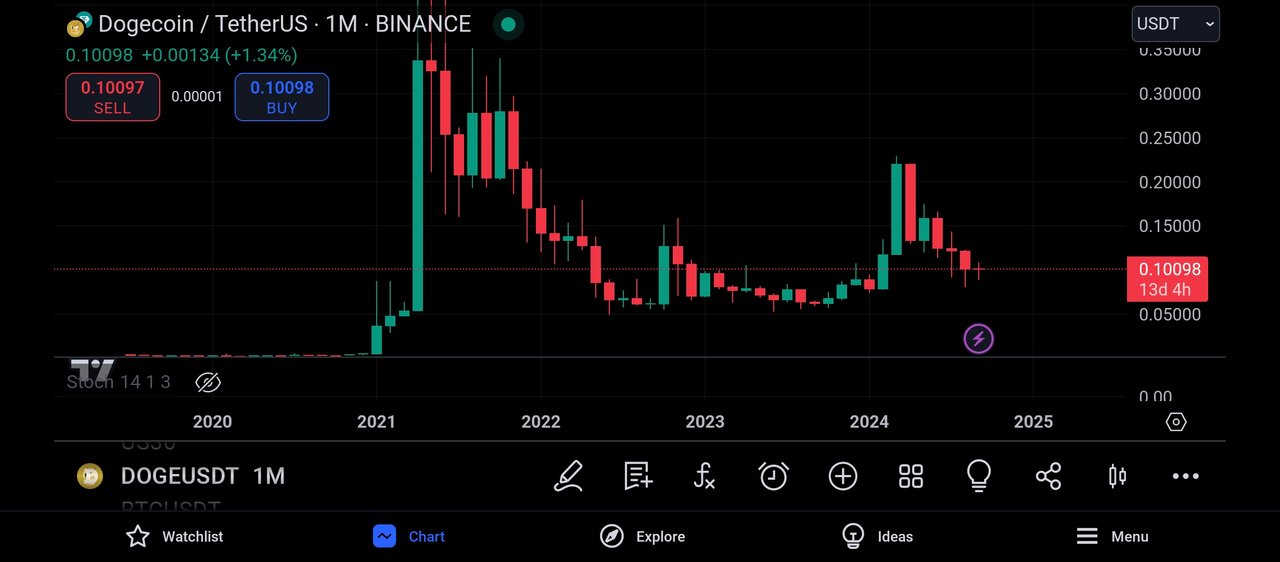
The above screenshot is that of dogeusdt on the monthly timeframe and as seen above there is the formation of bullish and bearish candles.
Also, we can see that there are lesser candles on this timeframe, and it is easier for the market trend to be identified.
And from the above screenshot, we can say that overall the market is still bearish although it's latest leg is being bullish.
And there are lesser noise on this timeframe which makes analysis here easier.
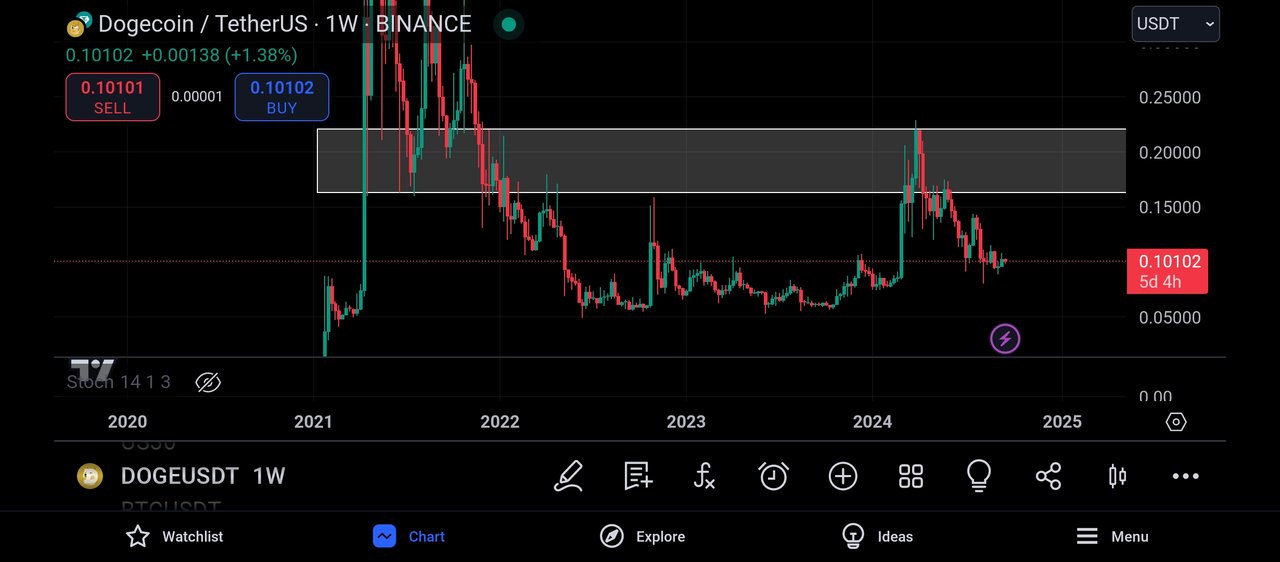
I then continued my analysis by moving to the weekly timeframe, and on this timeframe, I could see the market more clearly.
I could see that this timeframe has more candlestick than the monthly timeframe and this is because each candle formed in this timeframe is formed within the trading period of 7days.
And looking carefully at the market, I was able to identify a key level and this level is functioning as a resistance level to the market, and the market is expected to be rejected whenever it trades towards this level.
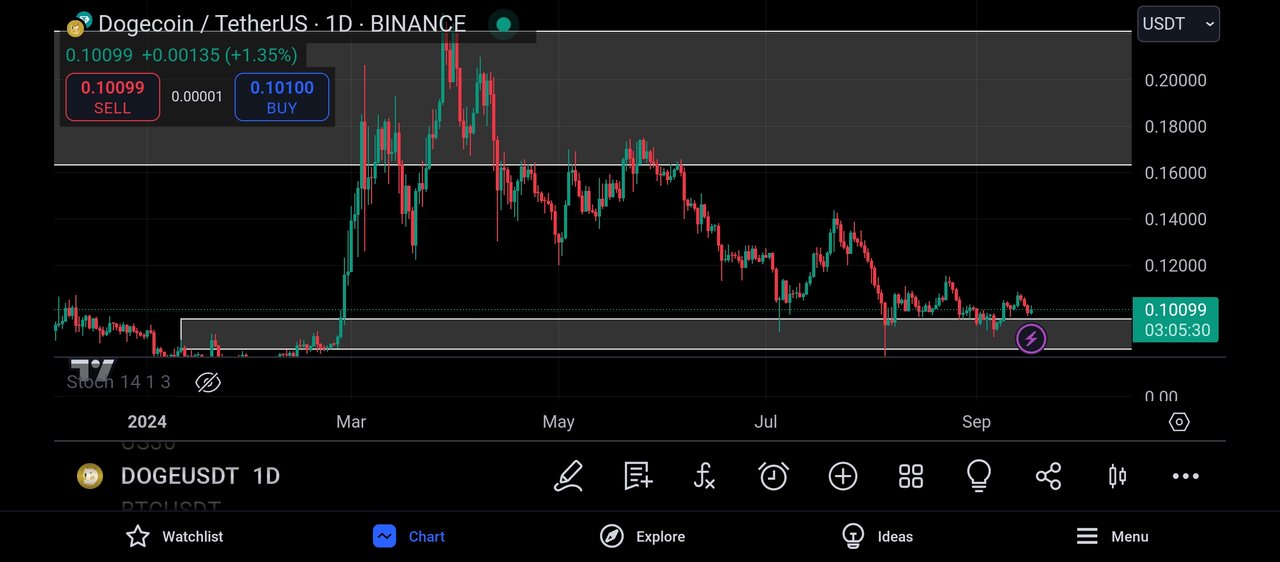
To continue my analysis, I then proceeded to the daily timeframe and on this timeframe, I could see the market more clearly.
The candles on this timeframe is being formed after the trading period of 24hours and also on this timeframe, I was able to identify another key level.
And this level is functioning as a support level to the market price and the market is expected to be rejected whenever it trades towards this support level.
And from the above screenshot, we can see that this level is a valid level as it has been tested severally by the market.
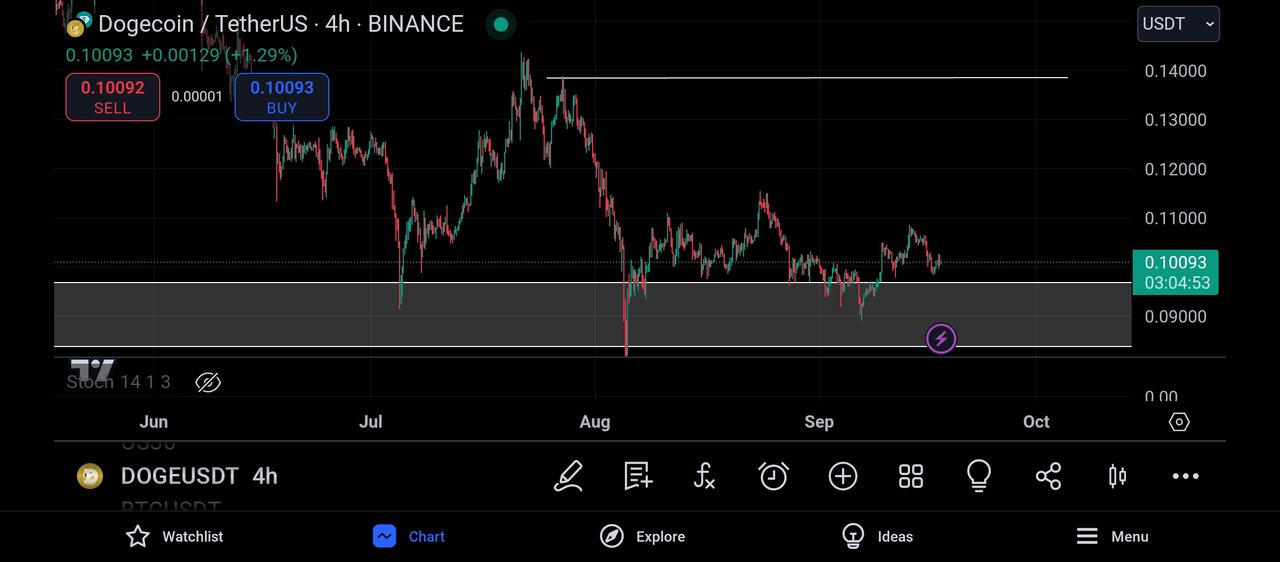
I then continued my analysis by moving to the 4hr timeframe, and on this timeframe, I could see the market more clearly.
I could see lots of noise in the market which shows the presence of the buyers and sellers as struggle to drive the market to their preferred direction.
And from the above screenshot, I could see that the market has just been rejected from this support level and I expect the market to retest this level again before I place my entry.
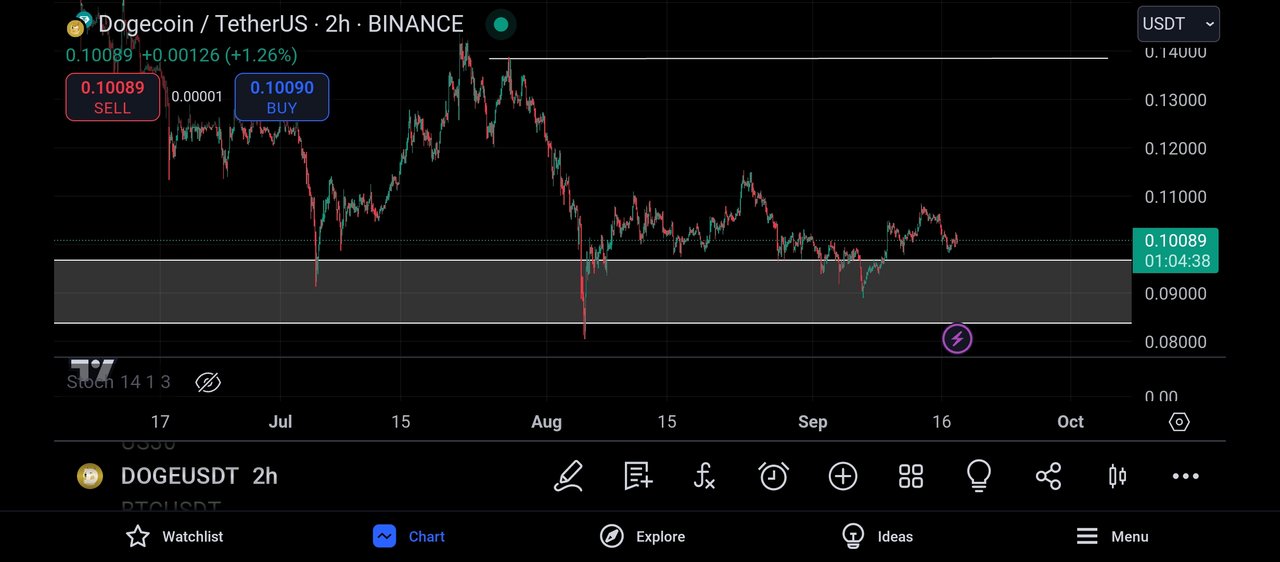
I then moved to the 2hr timeframe and on this timeframe, I could see the market noise more clearly.
And with my bullish bias of the market, I decided to search for my take profit region and this was marked with an horizontal trend line, just as shown above.
Then I decided to search for a trading confluence using the relative strength index indicator.
CONFLUENCE USING RELATIVE STRENGTH INDEX INDICATOR
The rsi indicator is a very important technical tool that is used in analysing the cryptomarket.
This Indicator is used to detect overbought and oversold market regions and this inturn influences my trading decisions.
When the market is overbought, it is a bearish trend reversal signal and when the market is oversold, it is a bullish trend reversal signal.
I then decided to apply this Indicator to the monthly timeframe first, before other timeframes.
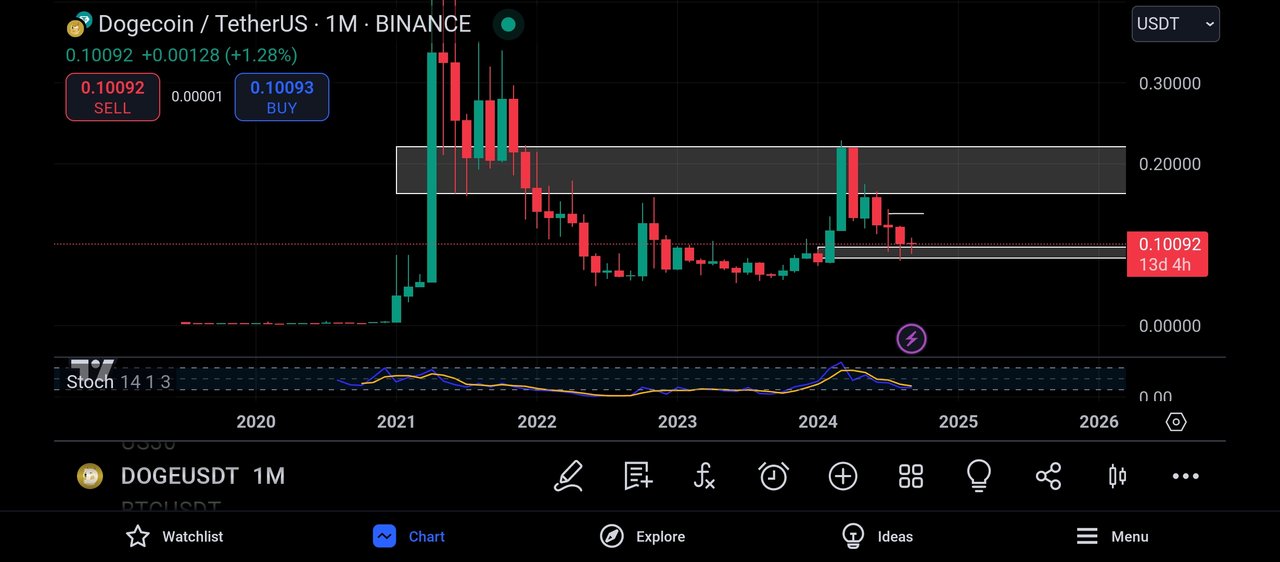
I then decided to add the rsi to the monthly timeframe and on this timeframe I could see the market more clearly and I could see that the market is being oversold.
And an oversold market is detected when the rsi crosses below its 20% line and this is a bullish trend reversal signal of the market.
An oversold market signals that the bears have become weak and the bulls are about to take control of the market.
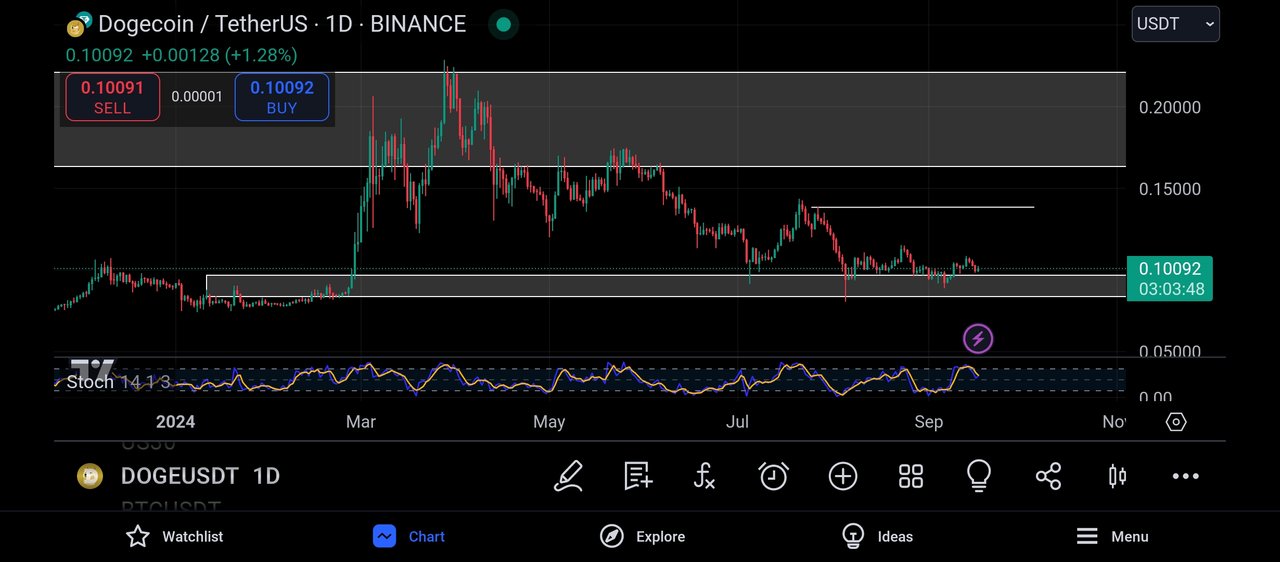
And moving to the daily timeframe, I could see that the market is being overbought and an overbought market can be detected when the market crosses above its 80% line.
And an overbought market can be understood to be a bearish trend reversal of the market, and this indicates that the bulls have become exhausted and the bears have gained strength in the market.
And as such, I moved to the 2hr timeframe in search of entry into the market.
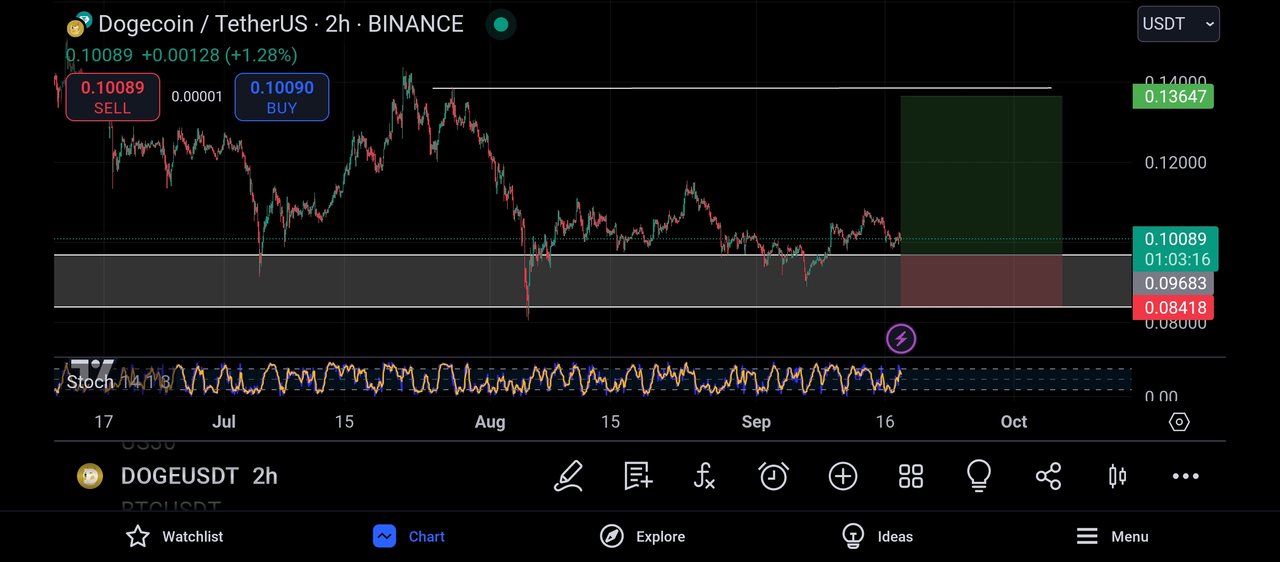
Getting to the 2hr timeframe with my bullish bias, I searched for an entry into the market.
I then decided to place my entry on the closest support level to the market and my take profit was placed on the closest resistance level on the market, just as seen above.
CONCLUSION
Doge coin is a token with good fundamental, and this can be confirmed from its historical activities.
I have shared my analysis on Dogeusdt, and I don't want it to be taken as a financial advise.
Thank you all for reading my post
Comments