Topdown Analysis Of BTCUSDT Using Support And Resistance Strategy And RSI Indicator As A Confluence
2 comments
Hello great minds,
It is a great opportunity to appear before you all today to share my analysis on bitcoin.
I believe you are all doing perfectly fine and are enjoying your activities in the community as you actively share in steemit promotion across various social media platform.
Bitcoin as we know it, is the father of all other cryptocurrency and it is worth carrying an analysis on, since it is the driver of all other cryptocurrency in the cryptospace.
Today, I will sharing my analysis of btcusdt and I will be beginning from the monthly timeframe.
ANALYSIS USING SUPPORT AND RESISTANCE STRATEGY
My analysis often begin from the higher timeframe and it moves to the lower timeframe.
On the higher timeframe like the monthly timeframe, I identify market trends, and on other timeframe I search for key market levels and also search for entries into the market.
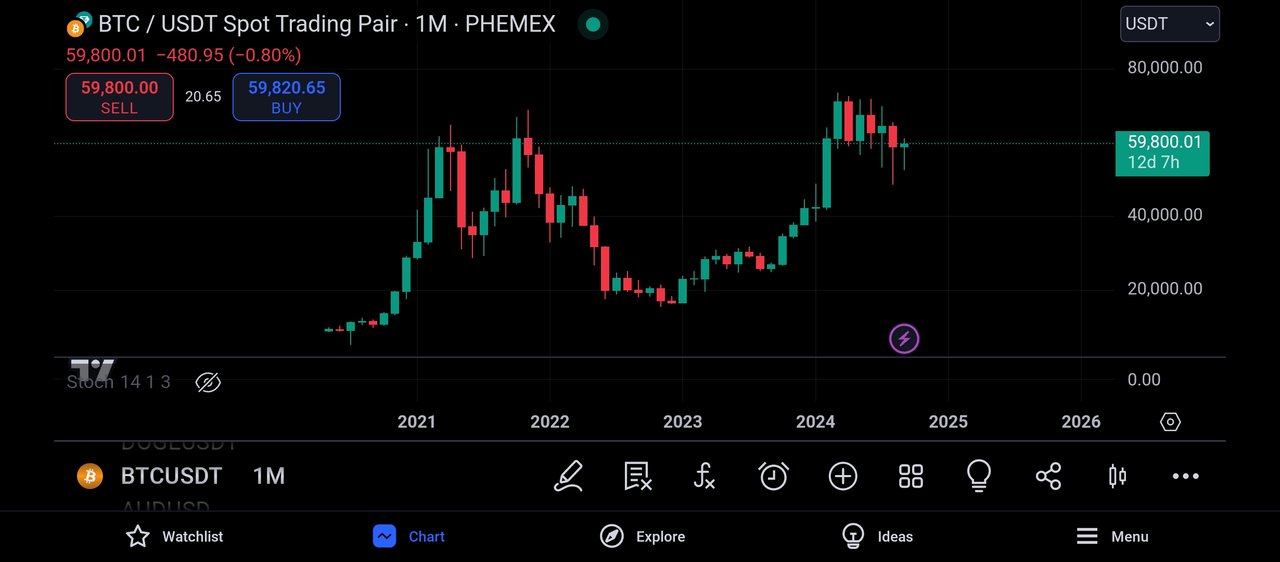
The above screenshot is that of btcusdt on the monthly timeframe as we can all confirm.
And from the above screenshot, we can see that there are less candles on this timeframe, and this is because each candle formed on this timeframe takes an activity period of one month.
Also on this timeframe, we can notice that the market trend is easily identified, and from the screenshot above, we can see that Bitcoin market is bullish overall.
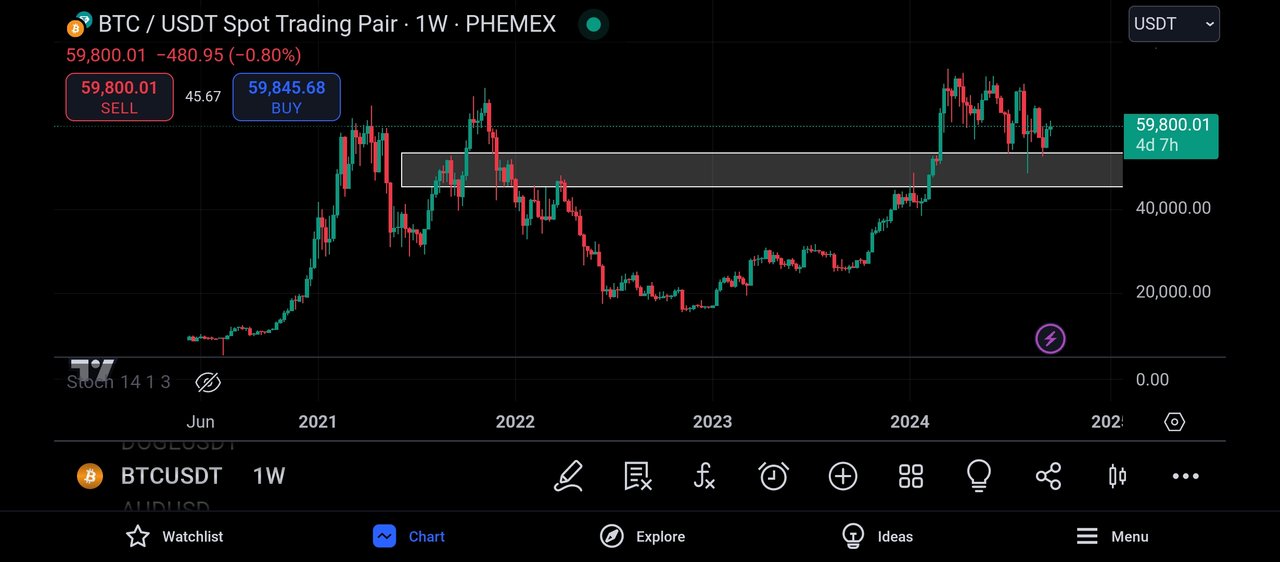
I then continued my analysis by moving to the weekly timeframe and on this timeframe, I could see the market more clearly, I could see more candlestick on this timeframe than on the monthly timeframe.
And this is because each candle on this timeframe is being formed after a trading period of 7days, and on this timeframe, I could identify a key level.
This identified level will be functioning as a resistance level to the market price , and the market is expected to be rejected whenever it trades towards this level.
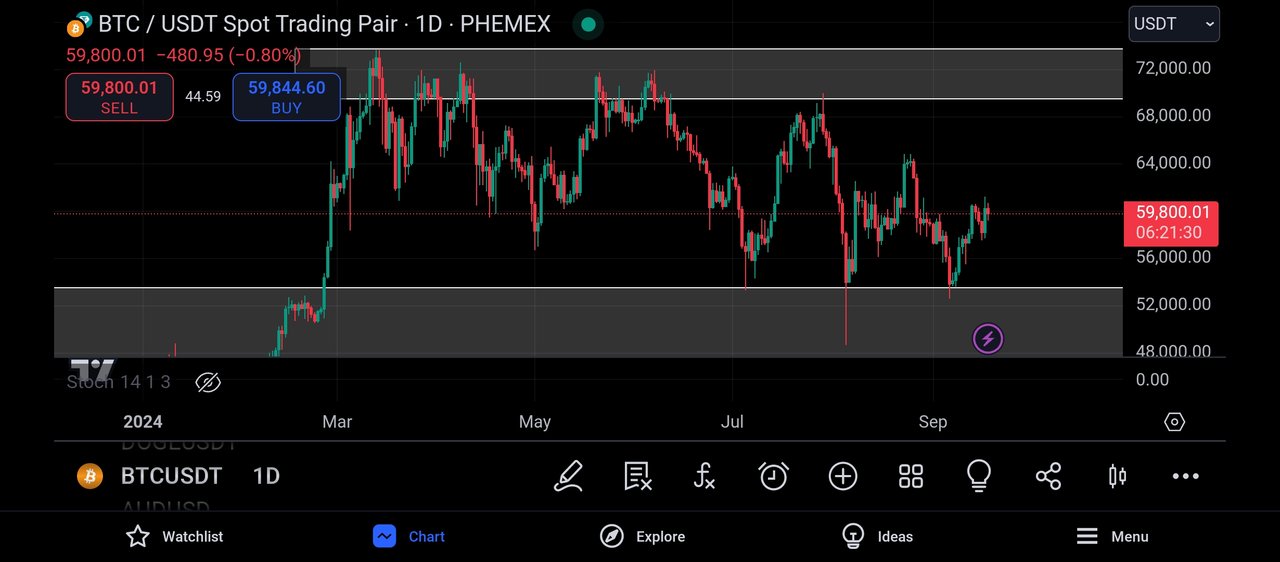
I then moved to the daily timeframe for more activities, and on this timeframe I could see the market more clearly.
The candles on this timeframe take a trading period of 24hrs before it can be formed and because of that, the candles on this timeframe is more than that on the weekly timeframe.
And looking carefully, I was able to spot another key level and this level is functioning as a support level to the market.
And from the above screenshot, we can see that the market has made several touches on this level and has been unable to break below it, which makes this level a valid level.
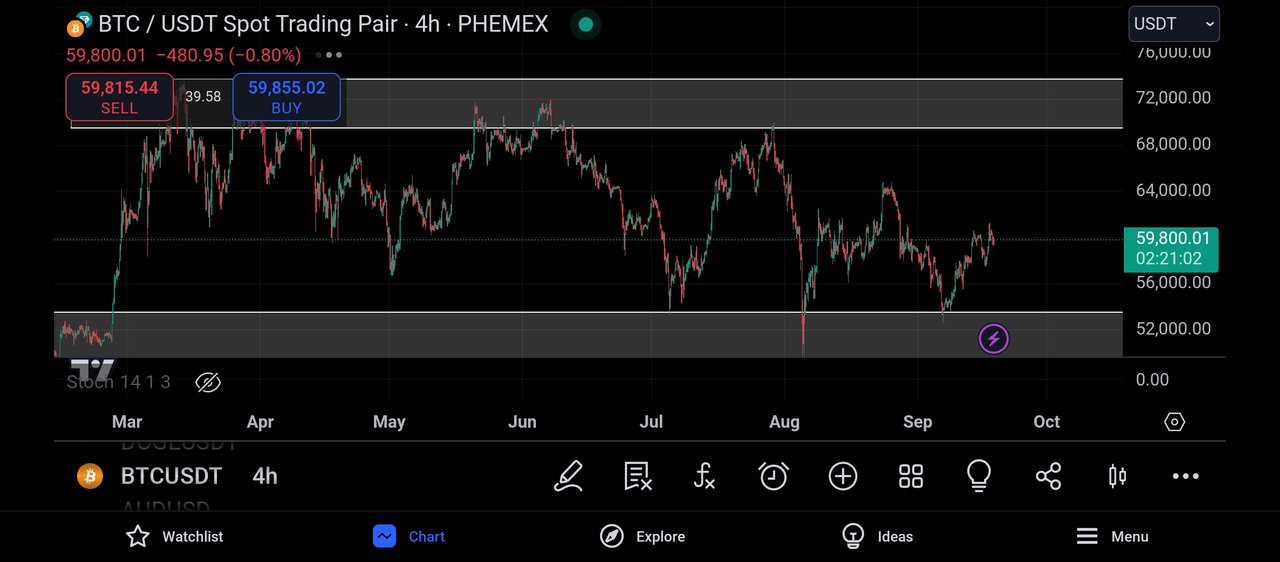
And moving to the 4hr timeframe, I could see the market more clearly, I could see how noisy the market is.
I could feel the presence of the buyers and sellers in the market as they struggle to drive the market to their preferred direction.
And from the screenshot above, I can see that the market has just been rejected from this support level and it is trading towards its resistance level.
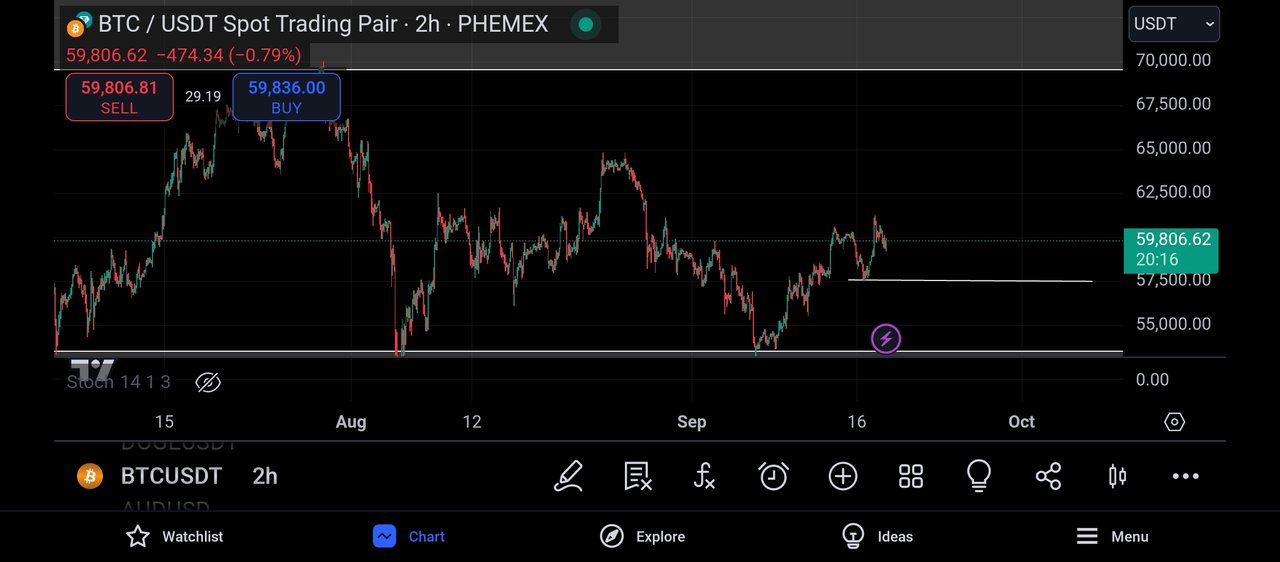
I then moved to the 2hr timeframe in search of an entry into the market, and my bias towards the market is bullish, I expect to see the market trade towards this resistance level.
And then I expect to see a bearish retracement in the market before it begins it's bullish move and before then I decided to search for trading confluence using the relative strength index indicator.
CONFLUENCE USING RELATIVE STRENGTH INDEX INDICATOR
The relative strength index indicator is an indicator that helps to identify overbought and oversold market.
When a market is spotted to be overbought, it is a bearish trend reversal signal and when it is oversold, it is a bullish trend reversal signal.
An overbought market can be spotted when the rsi crosses above the 80% line and an oversold market is detected when the market crosses below the 20% line.
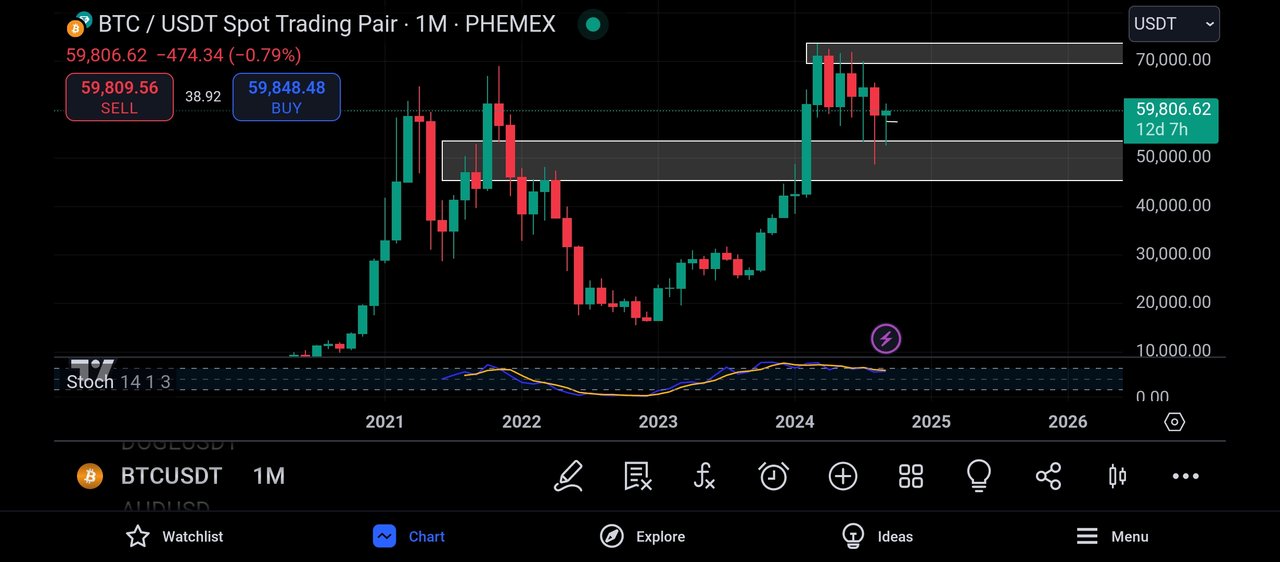
I then decided to add the rsi to the monthly timeframe and on this timeframe I could see that the market is being overbought and an overbought region signals a bearish trend reversal of the market.
An overbought market is detected when the rsi crosses above its 80% line, and this is an indication that the bulls are weak and the bears are taking control over the market.
And this implies that we would see some bearish movement in the market.
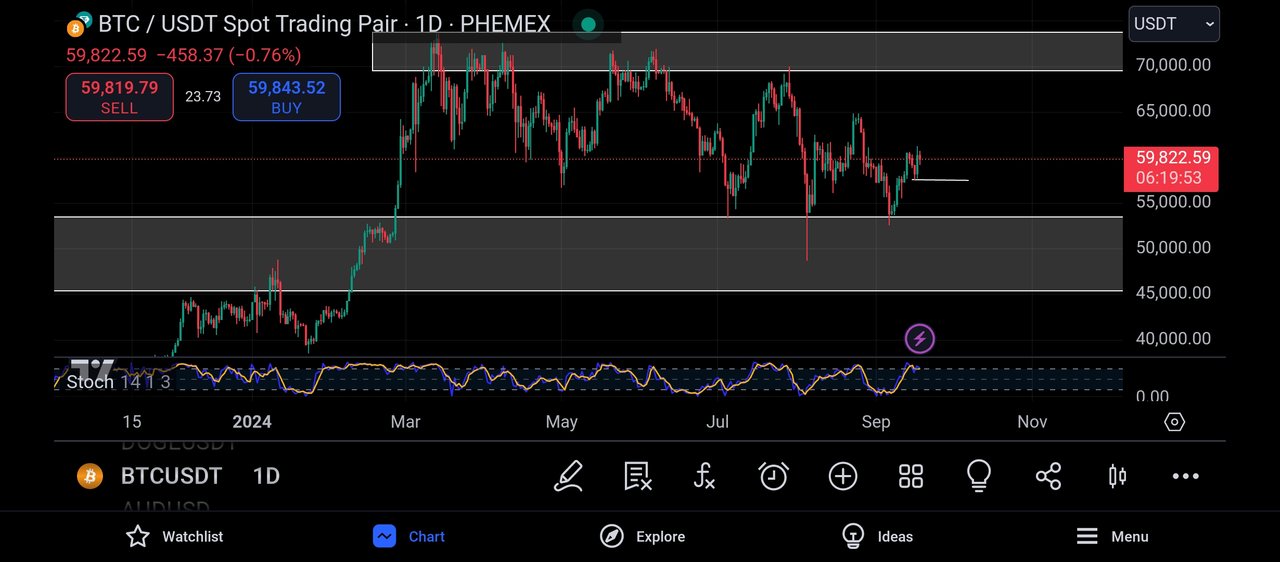
And getting to the daily timeframe, I could see that the market is being overbought, and as explained earlier, an overbought market is detected when the rsi crosses above its 80% line.
As I explained earlier, an overbought market signals a bearish trend reversal of the market, that is, a change in market strength from the buyers to the sellers and with this, I decided to move to the 2hr timeframe in search of entry into the market
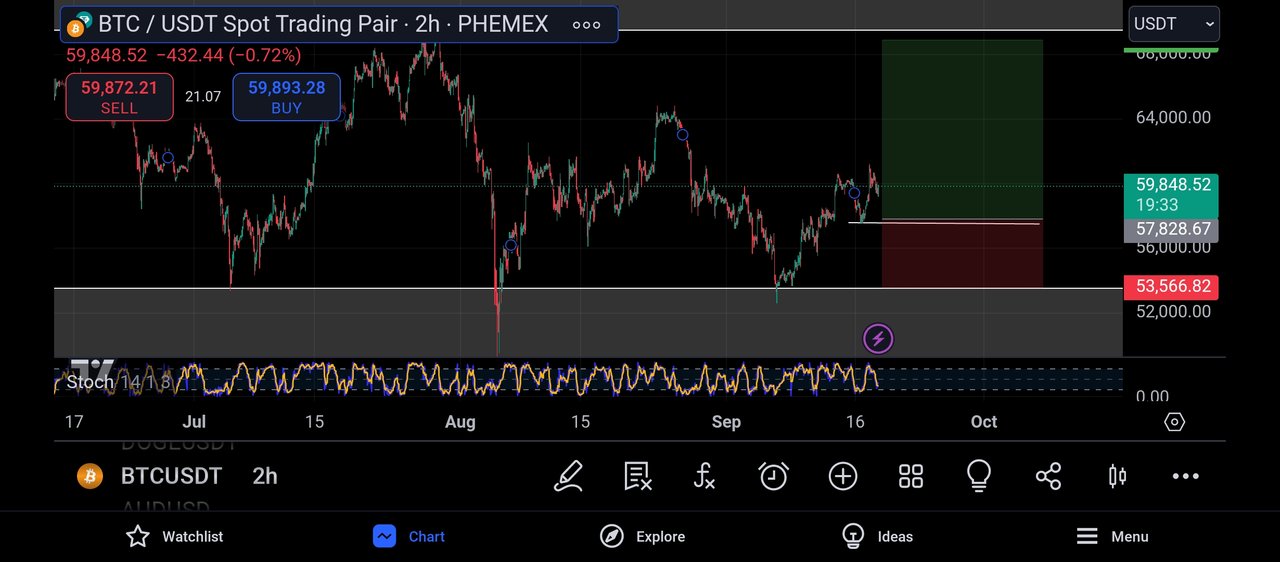
And moving to the 2hr timeframe with my bullish bias of the market, I search for the most recent bullish order block formed by the market.
And then I placed my buy entry on this level and my take profit was placed on the closest resistance level to the market price, just as seen above.
CONCLUSION
Bitcoin is the father of all cryptocurrency and it is the driver of all other altcoins in the cryptomarket.
I have shared my analysis on the market and I expect to see a momentary bearish retracement and a bullish continuation move.
Comments