Analyzing and Demo Trading of STEEMUSDT using the Support & Resistance Strategy
5 comments
Background Image Edited on Canvas
Hi, fellow crypto lovers,
I remain your favorite crypto analyst in the person of @simonnwigwe from Nigeria 🇳🇬 and it is a great pleasure on my part to share with you all the analysis I did today on a new pair of crypto assets called the STEEMUSDT.
Seeing the movement of the market recently, one will be tempted to ask if we are still going down or if we are going upward. As of yesterday, we saw blood in the street of the crypto market where almost all the crypto assets dropped by about 50% from their initial price, and the case of our dear Steem token was not an exception.
After that movement, a lot of users came to my DM asking if we would continue downward or if the market made that move to pump upward. Well, I told them that a lot of factors are involved when it comes to the crypto movement but I would like to analyze the market and see how far it goes.
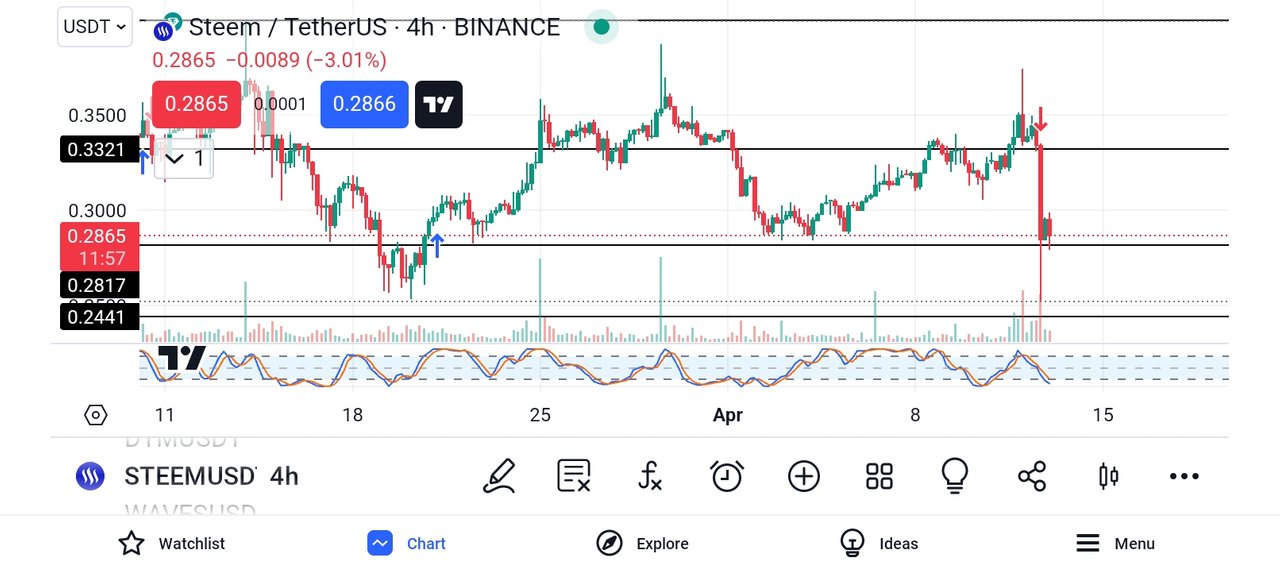
This is the main reason I have come up with the analysis of these pairs today. From the screenshot above, you will notice that the bearish volume is much stronger which shows that sellers are the controllers of the market. With that, I decided to consider other factors such as the support and resistance level and the indicator to make my decision.
Though from the market, you can see that the point of support was rejected by the price but the volume shows that the sellers still hold ground in the area. This is the reason I decided to sell the market instead of buying it.
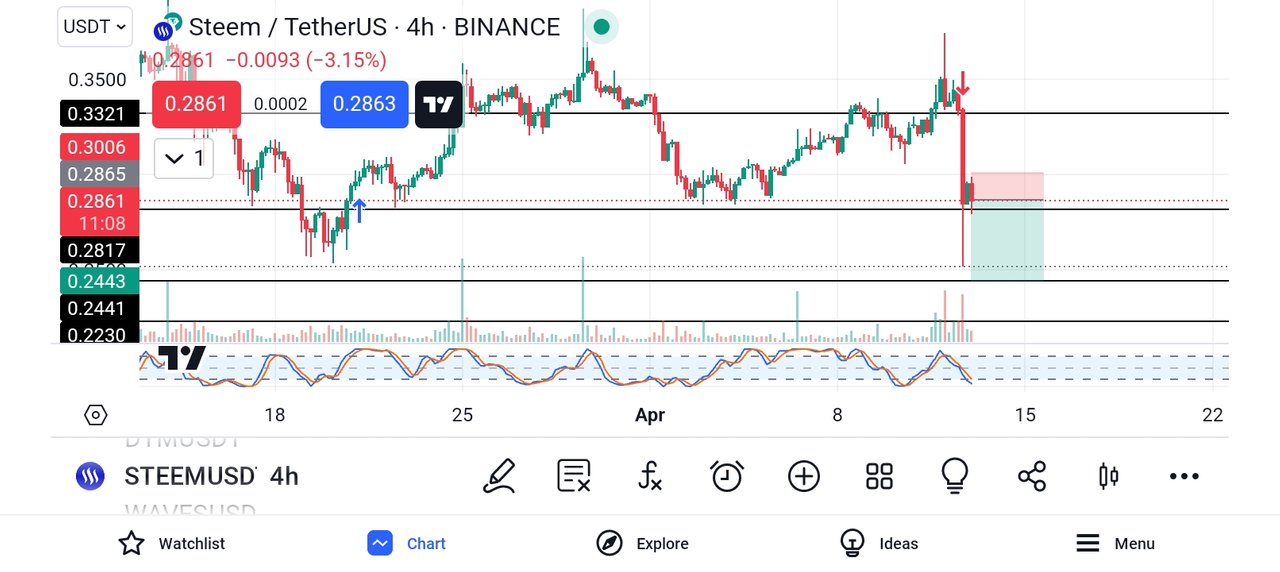
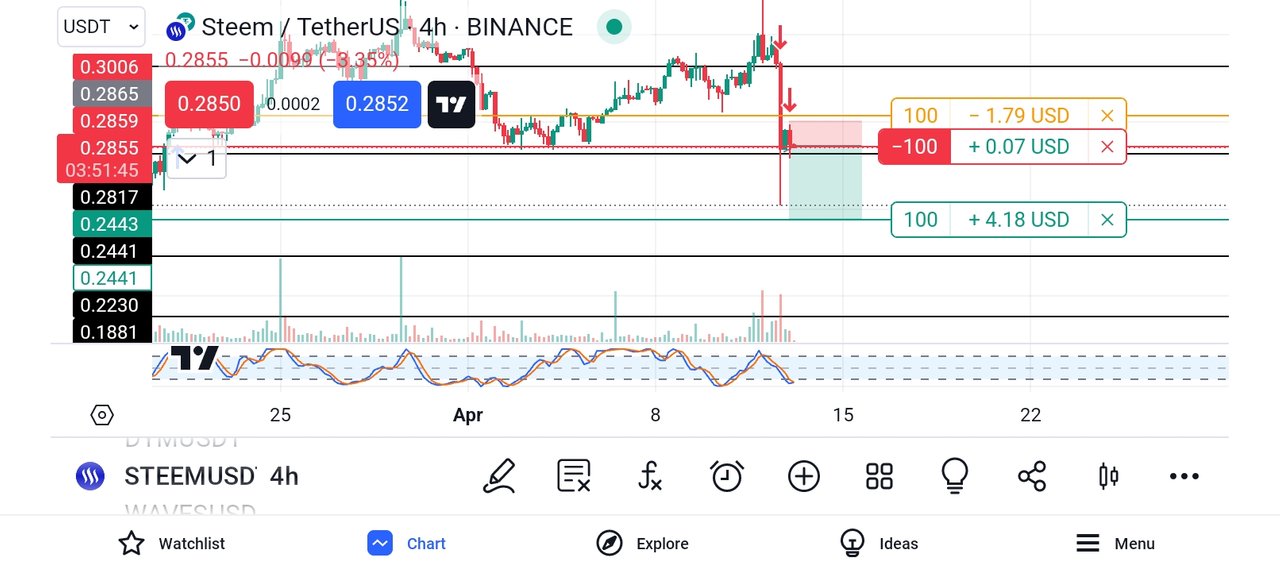
To do that properly, I brought in the sell logo as you can see from the screenshot above. From the screenshot above you will notice that the sell logo shows that the take profit of the market is located at the next support level and the stop loss was just above the last bearish candle.
The risk management involved in the trade is around 2:10 which is a good risk-reward ratio. We continue to monitor the market and see how it goes and to do that more properly a demo trade will be initiated following the below paragraph.
To properly keep track of the progress of the said pair of assets, I decided to introduce a demo trade to at least keep me on track and in check so that I will have a little emotion when the market goes in my favor or against me. See the screenshot below.
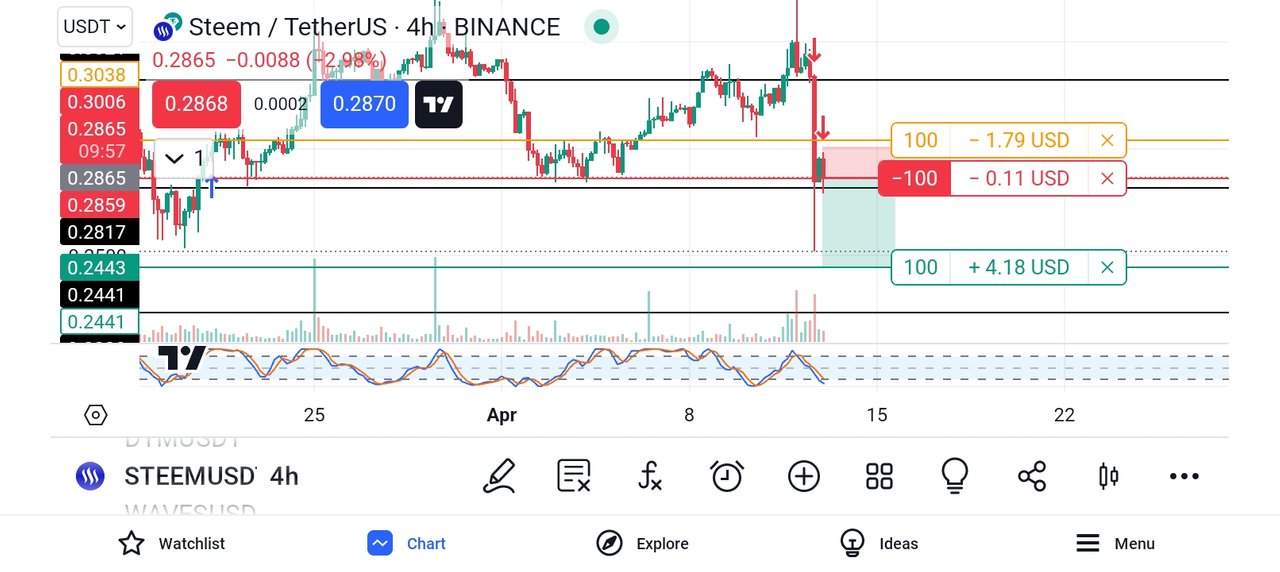
From the above screenshot, you will notice that the demo trade has been activated already. If the market goes as predicted, then I will be able to earn a total of 4.18 USD, and if the market goes against me for any reason I will lose 1.79 USD. This shows that it's a good risk-reward ratio if you ask me.
Finally, I also decided to go to the position side to get complete information on the market so that you all can see it more clearly. The details below talk about the points where I take my profit, my stop loss, and even the current price of the asset when I'm making the post.
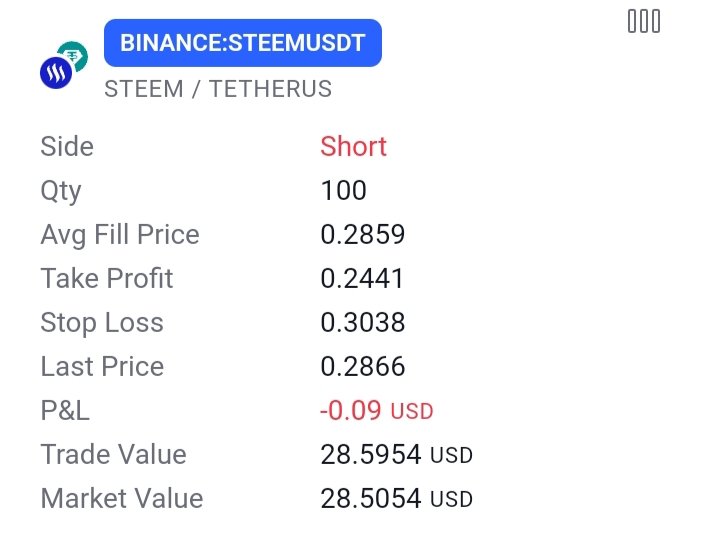
From the screenshot above, you will notice that the side is short (sell), the quantity is 100, the average fill price is 0.2859, the take profit level is at 0.2441, the stop loss is at 0.3038 and lastly the P&L at the moment is -0.09, that is all about the open order.
After a while, I decided to check back on the trade to see if the market was going in my favor or against me. Going through the chart I saw that the market respected my analysis and that is what gave us the result you can see from the screenshot below.
From the above screenshot, you will notice that the profit made is already at +0.06 USD which means our analysis is in my favor at the moment. I will still hold on to the market and see the final movement of the asset because I'm confident that it will go in my direction. So let's be patient as the market will still go as predicted.
Conclusion
Based on the analysis, you will agree with me that there are possibilities that we may still come down a little more and the target is to hit the next support level. I will advise all traders to keep an eye on the market because we never can tell the next move. So set your limits and then relax and allow the market to do its things. Always use a good stop loss and take profit.
Remember also that trading is like meditation, patience is the key. Always wait for the market to come to you and not for you to go to the market. Learn to identify your key support and resistance level and also trade with the trend and in that way, you will be a successful trader.
Finally, I want to thank you all for reading through my post today. If you have any questions or contributions, please do well to use the comment section of this post. See you all in my next publication.
Disclaimer: This post is made as an education and not investment advice. Digital asset prices are subject to change. All forms of crypto investment have a high risk. I am not a financial advisor, before jumping to any conclusions in this matter please do your research and consult a financial advisor.
NB: All images except otherwise stated are mine and taken from tradingview.com website
Comments