An introduction to the M and W Trading Patterns
3 comments
In the financial markets, using the right strategy can make you a huge amount of money, and at the same time, you can lose huge or fail to achieve success when you have failed to do what is right. W and M patterns are the best way of trading the financial markets as both patterns stand for bullish and bearish the two patterns refer to double top and double bottom patterns which we have discussed more in this post.
As a trader, it is good you have a deep understanding of these patterns W and M patterns so you can comfortably predict the market of whatever asset you want to trade. As we have early introduced from the beginning, we said that one of the patterns is for double top and the other one is for double bottom patterns. Let's explain them one after another.
| The W Pattern |
|---|
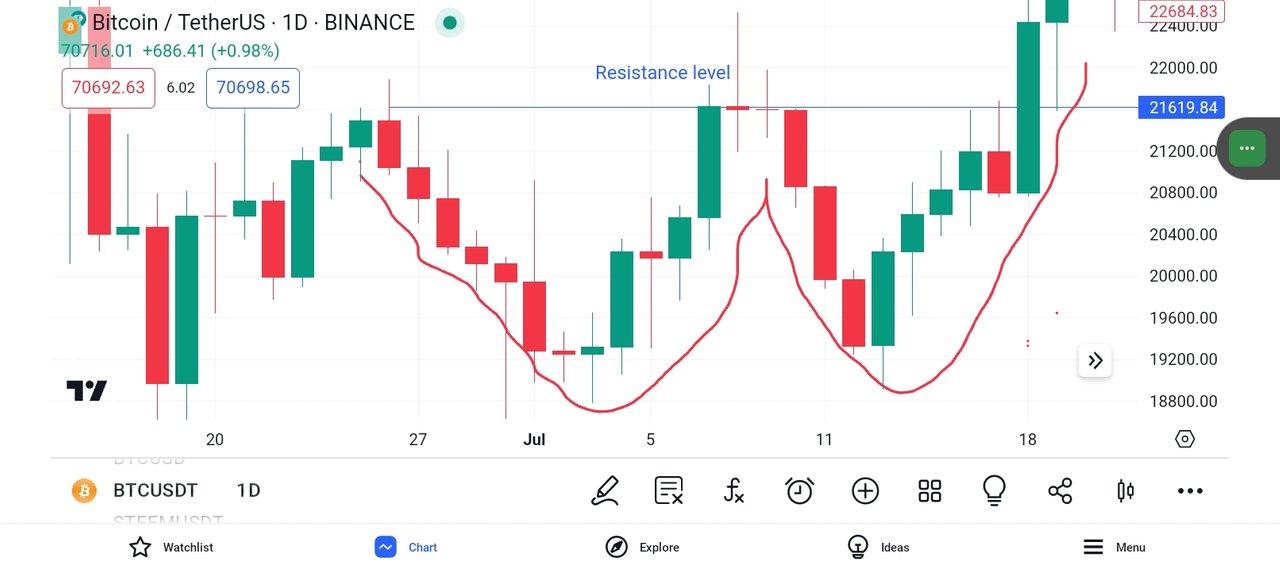
Before we begin, note that it is the W pattern that is the double bottom. It is seen as the bullish pattern as we have discussed earlier. This pattern identifies a trend reversal that begins from a downtrend to an uptrend which the shape is like "W" shape as seen in the screenshot.
Tradingview App
For you to identify a W pattern, you have to look for 2 troughs that begin from the support level, with a peak in the middle of the chart acting like the resistance level.
After the formation of the second trough in the chart, it is possible to see a rise in the price of the asset you are analyzing breaking through the resistance level. The W pattern is simply the pattern that lets you know that sellers have lost control of the market, and buyers have taken over the market.
| The M Pattern |
|---|
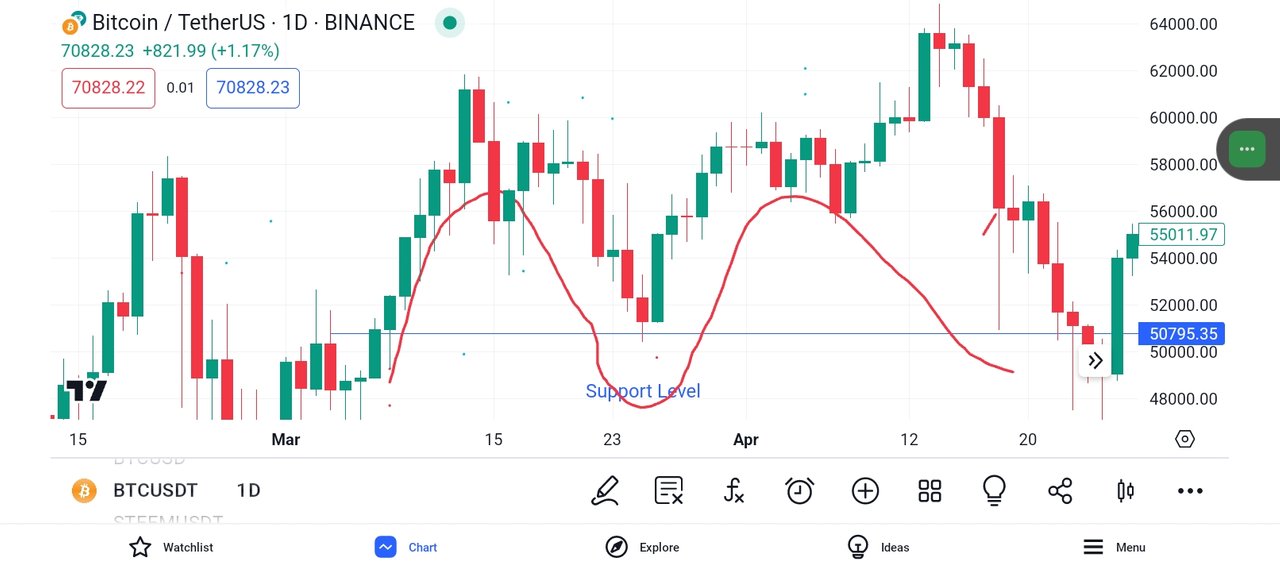
Before we begin, note that it is the M pattern that is the double top. It is seen as the bearish pattern that identifies a trend reversal that begins from an uptrend to a downtrend which is shaped in the form of "M" as seen in the screenshot.
Tradingview App
In the M pattern, you will 2 peaks resistance levels signal and a trough in the middle which indicates a support level. Now, when you see that the second peak is formed, you should know that the price of the asset you are analyzing is about to begin falling below the support level which results in a bearish market.
Identifying these two key patterns is very crucial and in this post, we will be discussing how we can identify them.
| Downtrend for W Pattern |
|---|
Tradingview App
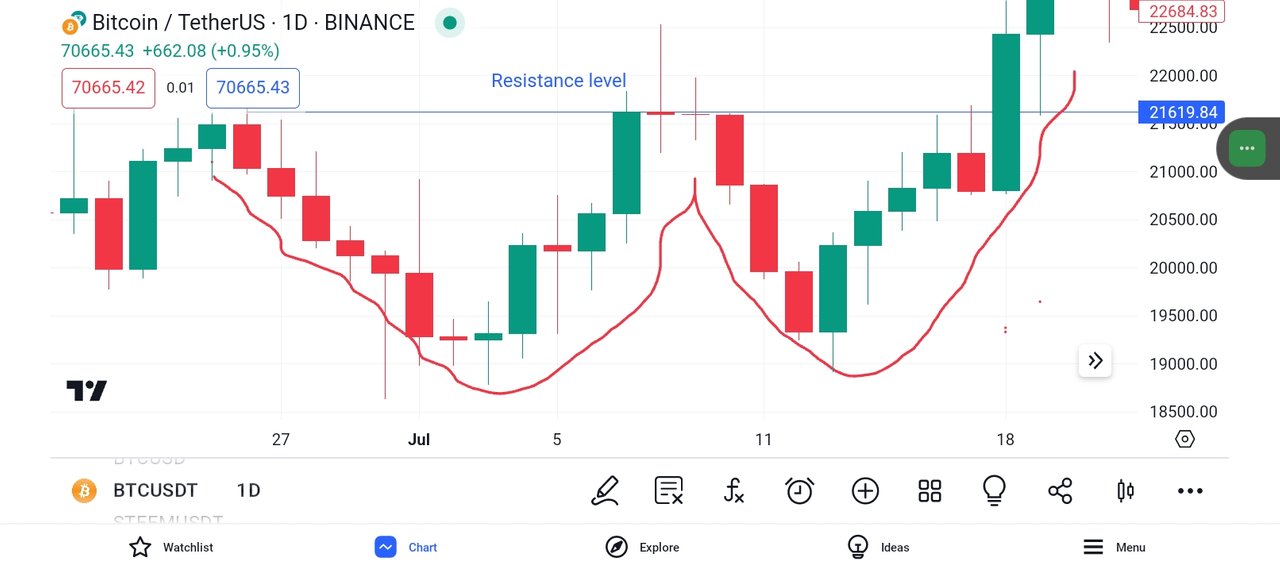
Note, that the opposite of our discussion here is for the M pattern. As said before W is for double bottom which we have seen in the screenshot image shared. Also, it is a pattern that has two troughs that look like a support level, with a peak in between. Now for you to identify the W pattern, look at the following:
You will see the price of the asset reaching a support level before bouncing up back again forming the 1st trough.
The price of the asset will begin to rise, again to a level that is between 20% above the previous decline in which the peak was formed.
Finally, you will then see the price of the asset falling back down to the level of support, creating the second trough.
The above characteristics mean the downtrend might likely reverse soon, and it can lead to a bullish breakout which you need to confirm by observing the price from the resistance level.
| Uptrend for M Pattern |
|---|
Tradingview App
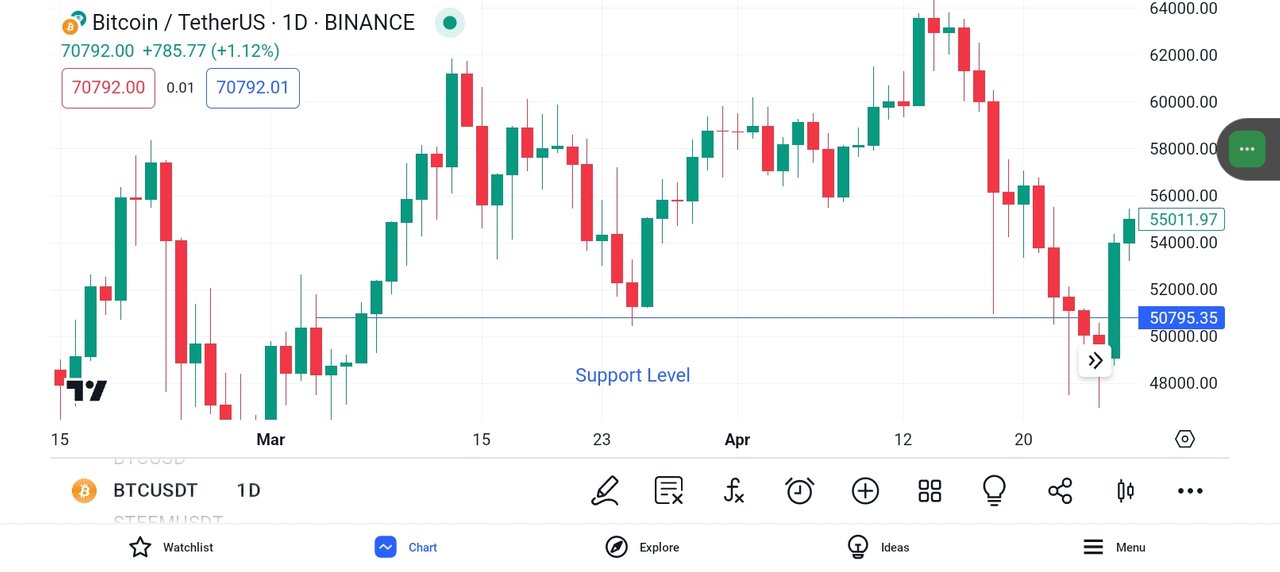
The opposite of what is discussed here is for the W pattern. As said before M Pattern is for a double top pattern which is seen in our screenshot image shared. It is the bearish reversal pattern that has two peaks like the resistance level, with a trough in between. Now, in kr d for you to identify the M pattern, look at the following:
You will see the price of the asset reaching a resistance level before falling, forming the 1st peak.
The price of the asset will then begin to decline again to the level that is between 20% to 50% of the previous rise forming the trough.
Finally, you will see that the asset will begin to climb up back to the level of resistance, creating the second peak.
The above characteristics mean the uptrend might likely reverse soon, and it can lead to a bearish breakout which you need to confirm by observing the price from the support level.
Conclusion
Today we have learned about W and M Patterns the best way you can trade this pattern is to combine other indicators like volume or any good technical indicators you know best. Note that this post is treated as educational content and not investment advice.
Comments