February March Solar Stats
9 comments
I have been slack the last two months so this post will fill in that 2 month period of Solar at my place, February was the month i had been waiting on as it was half way through February last year when we got the solar installed.
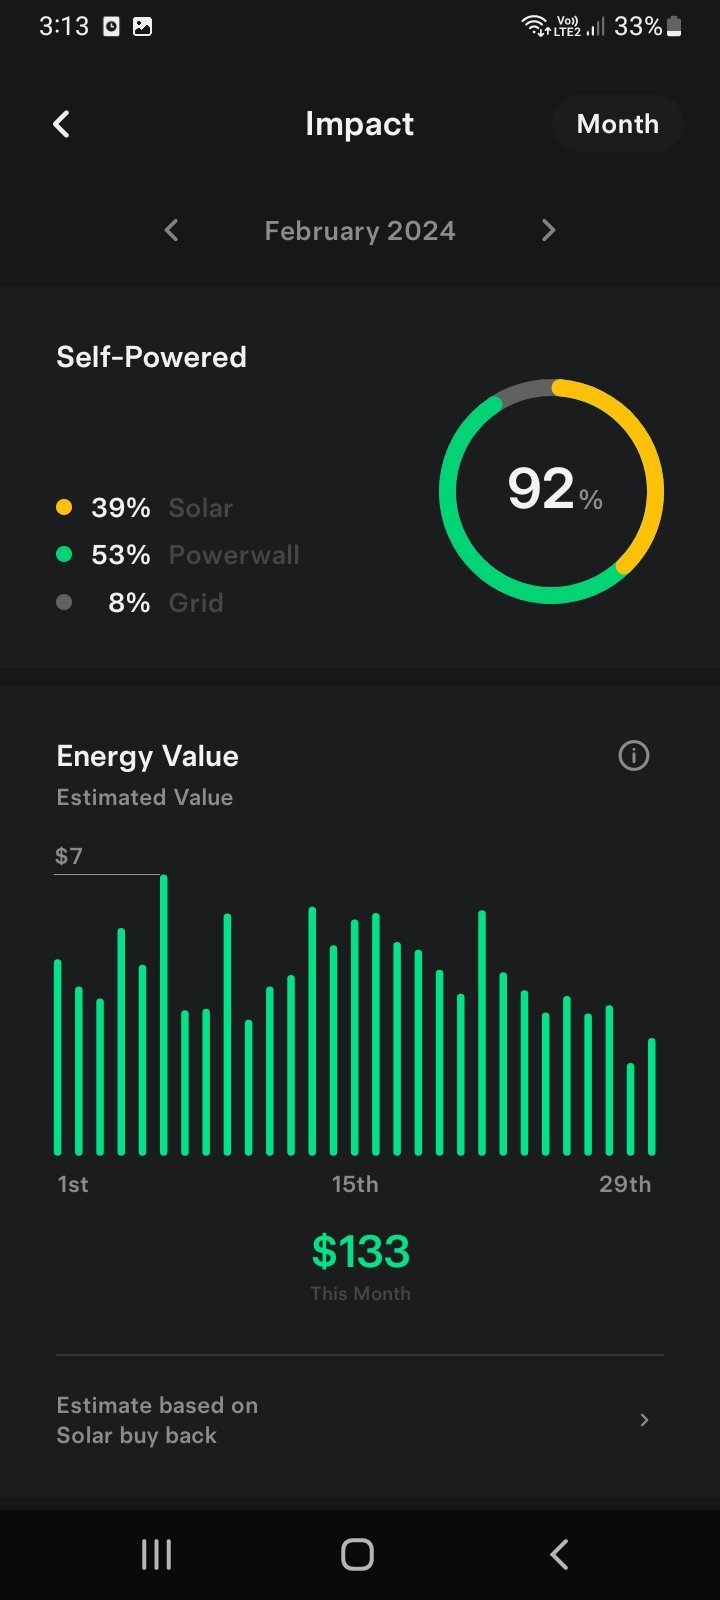
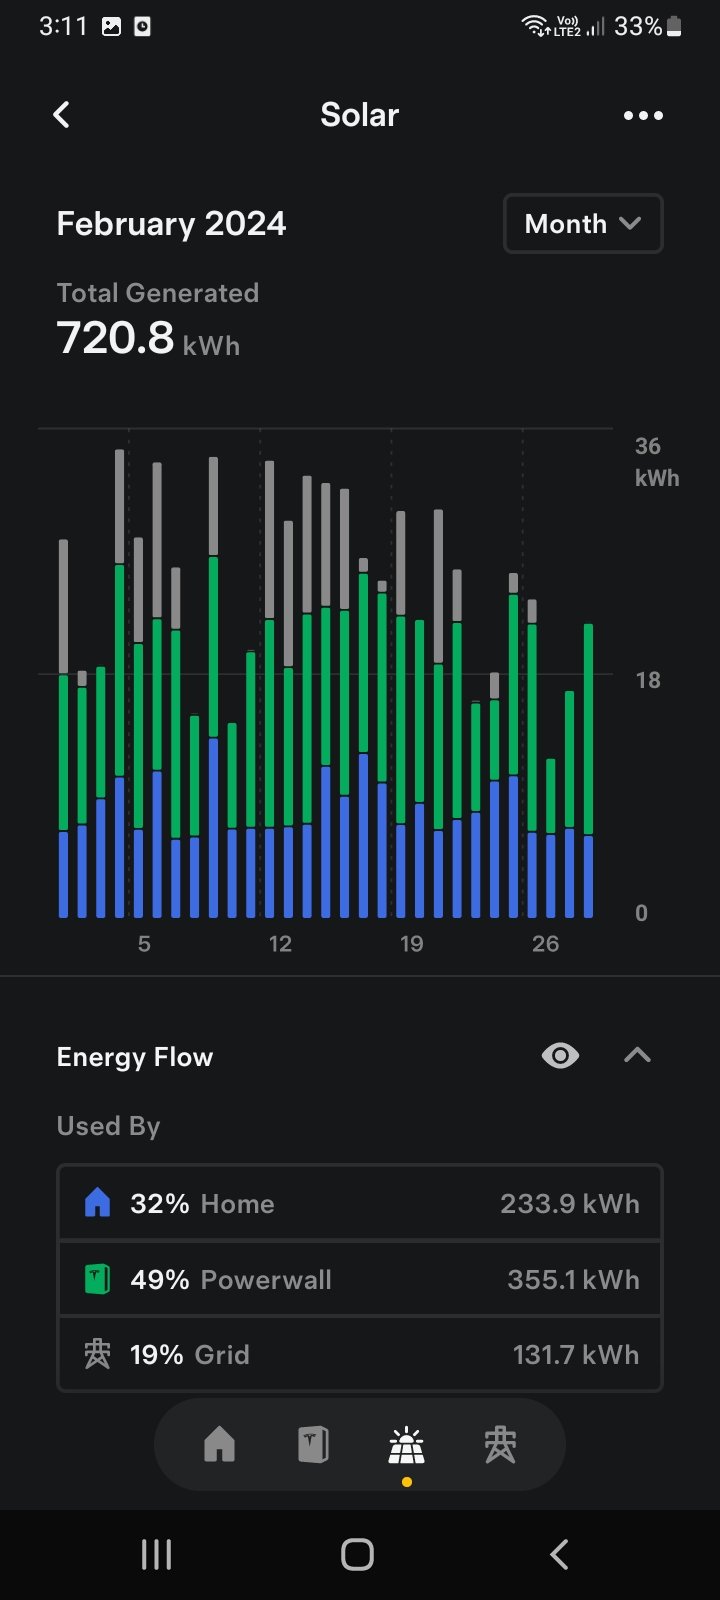
And February is our sunniest month here in New Zealand so i wanted to see how close to 100% self powered we could get. I started the month being in Tasmania Australia which had awesome sunny day's for the whole 19 days i was there.
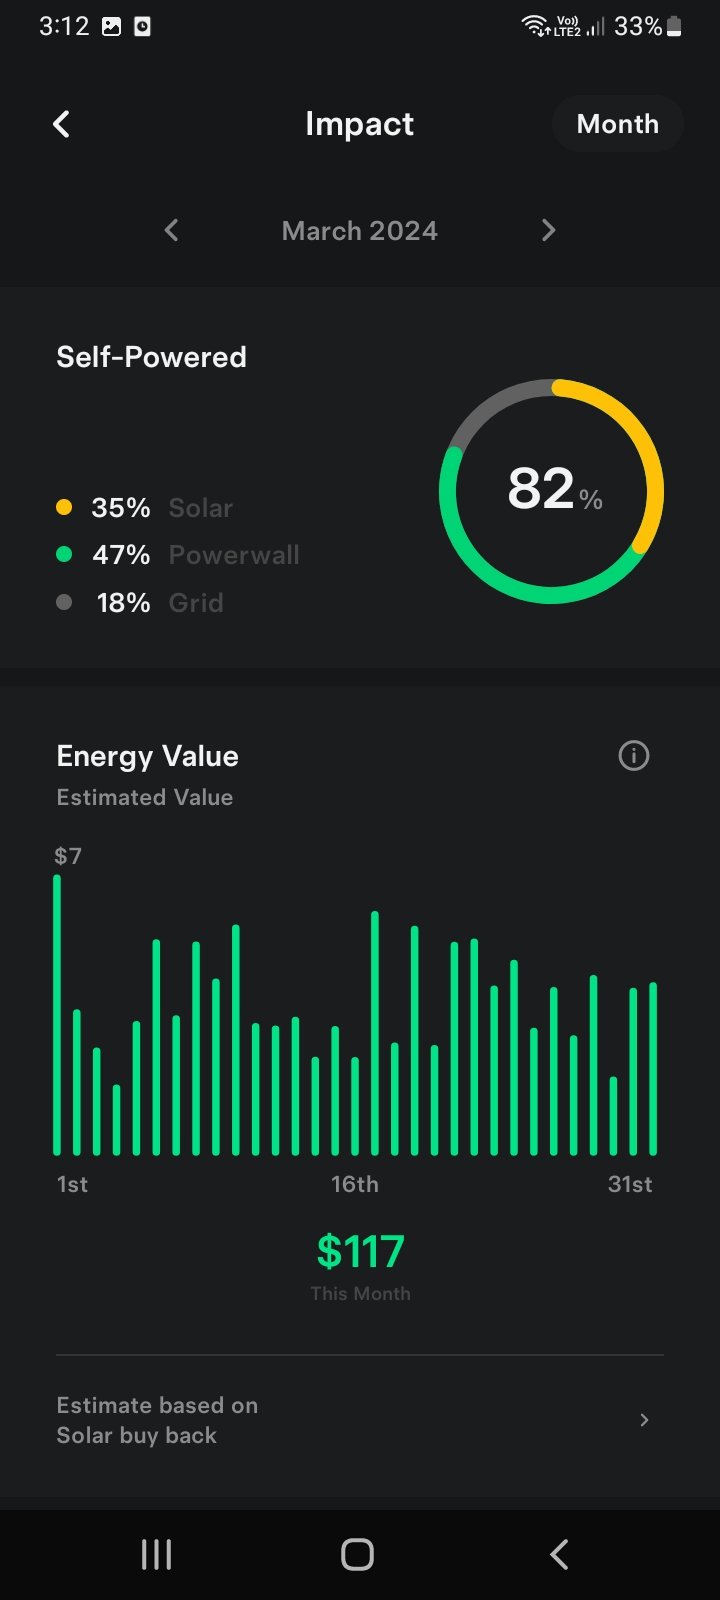
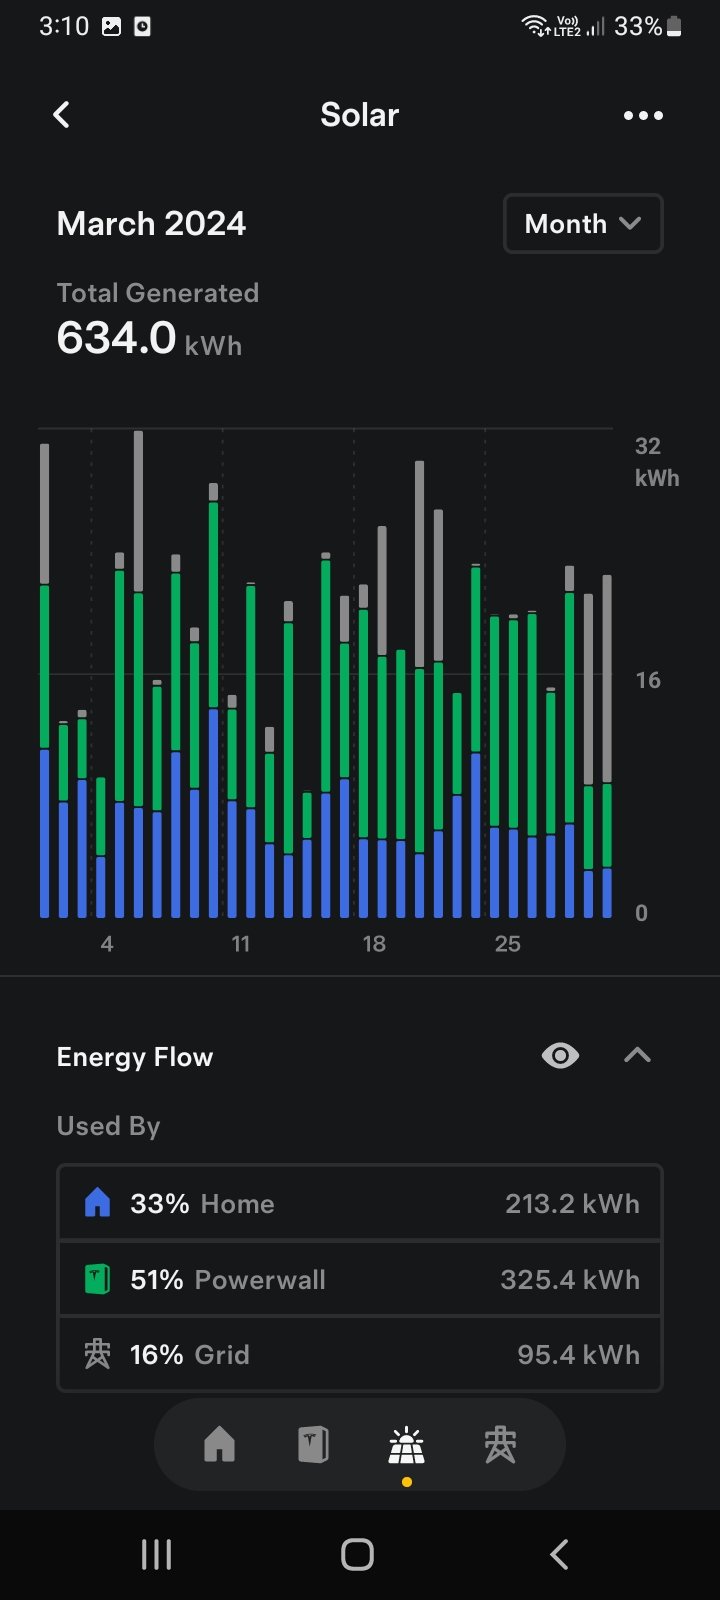
I could see back home via the Tesla App the same was happening and we had our best month being 92% self powered, not the 100% i wanted but still pretty good - March has been ok as well coming in at 82% self powered.
⚡🪫☀️⚡🪫☀️⚡🪫☀️⚡🪫☀️
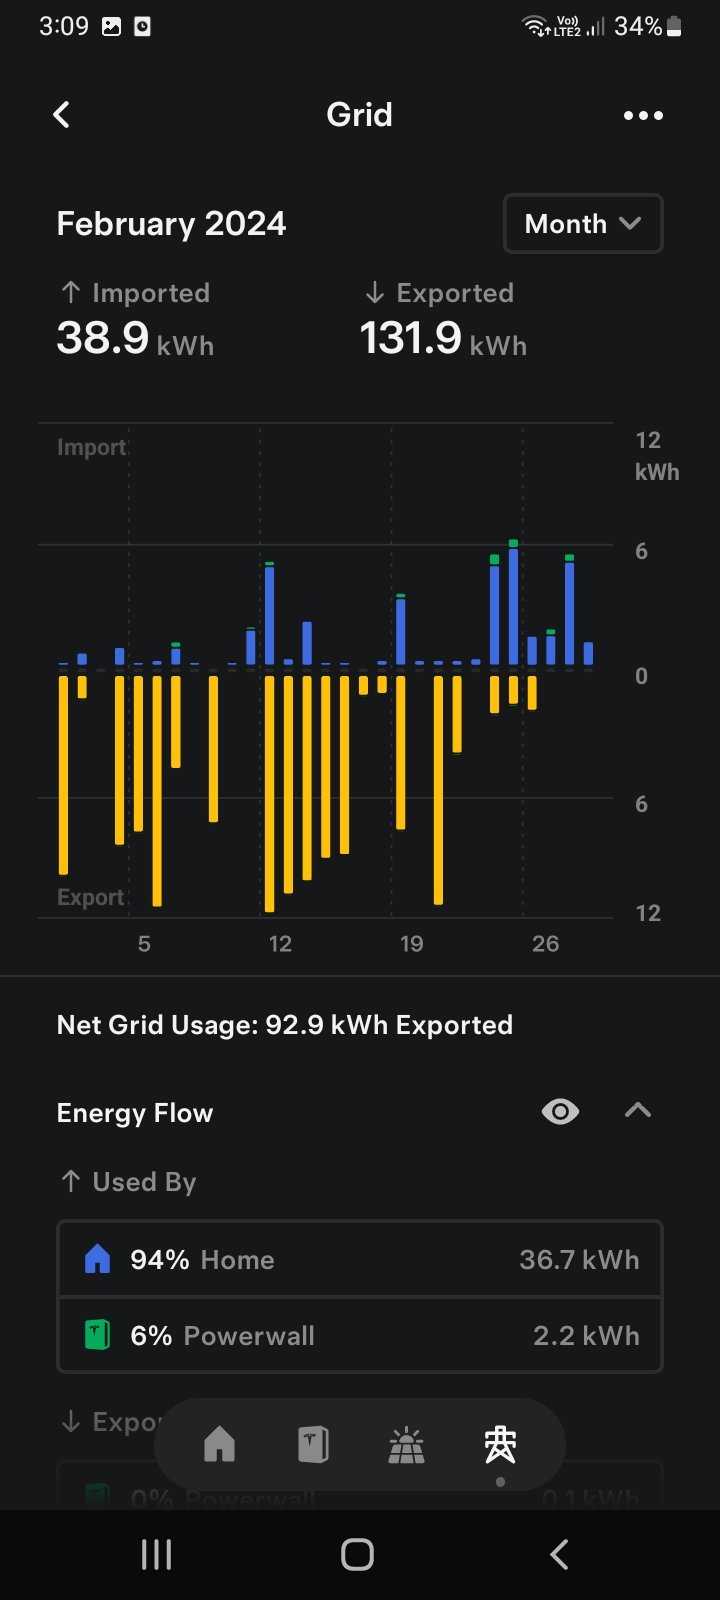
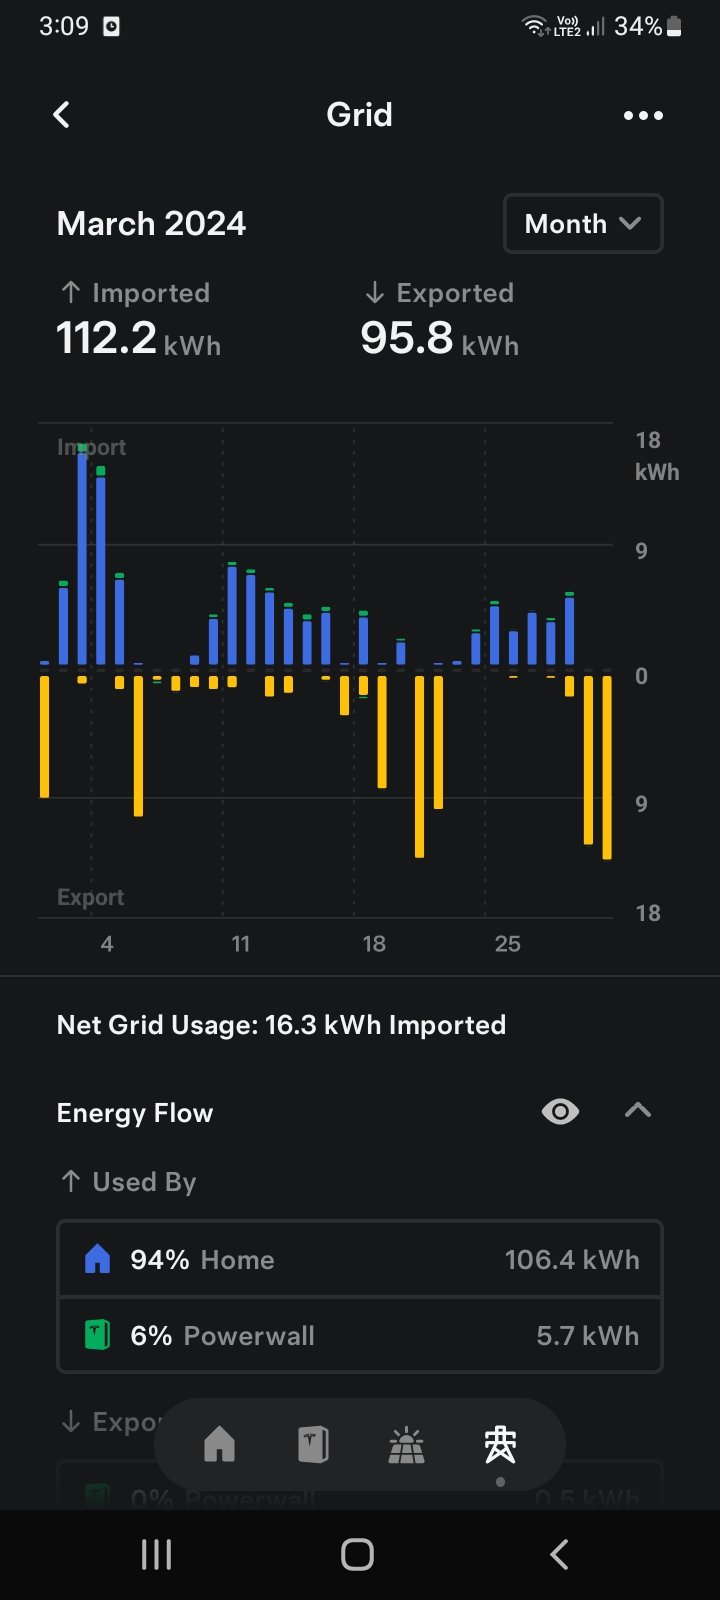
As you can see in February we were sending lots of power to the grid due to the Summer weather, that changed quite drastically in March.
⚡🪫☀️⚡🪫☀️⚡🪫☀️⚡🪫☀️
We generated 720KWH in February which remember is only a 29 day month, March generated 634KWH, our last 4 months powerbills have totaled $162 which 95% would be daily line charges we pay the be connected to the grid.
⚡🪫☀️⚡🪫☀️⚡🪫☀️⚡🪫☀️
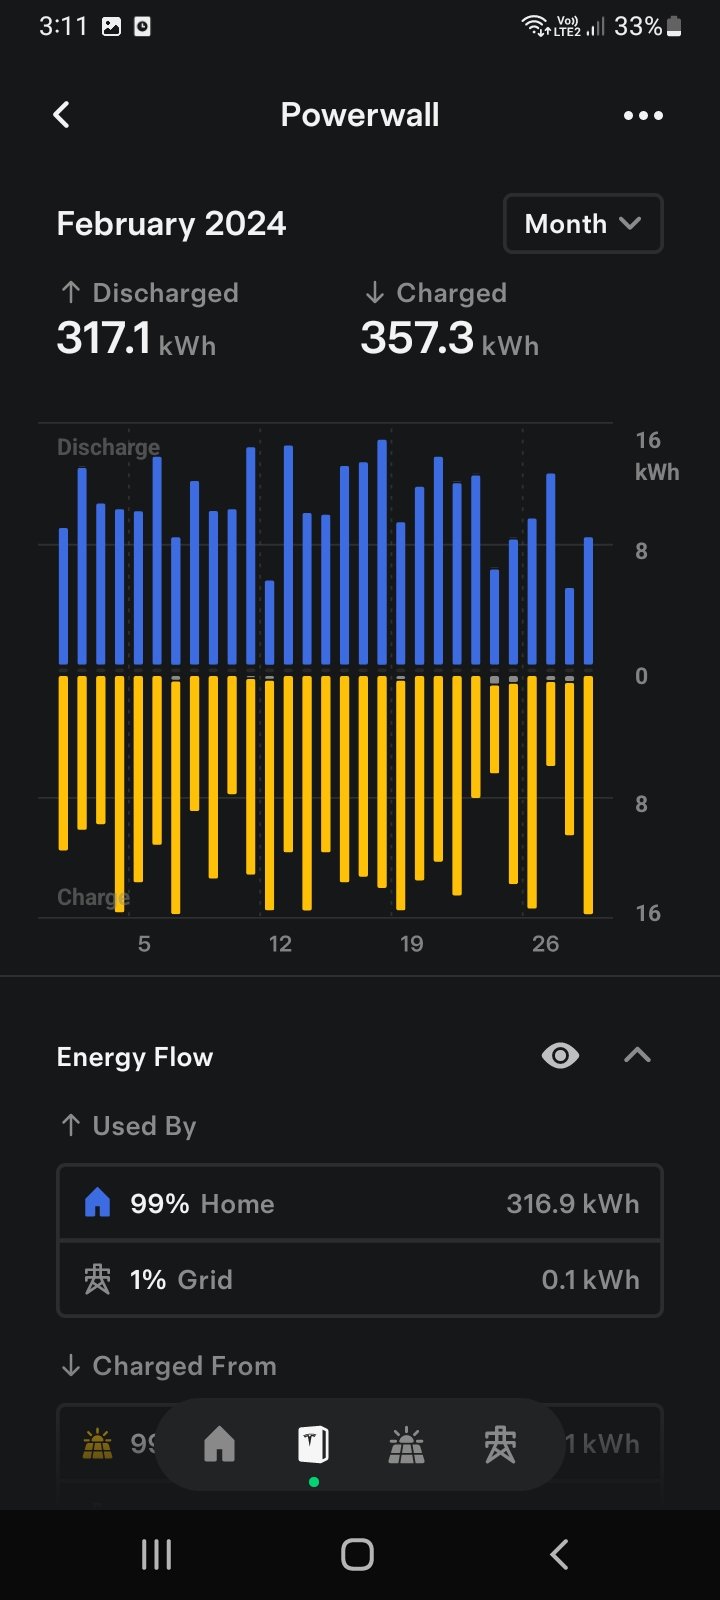
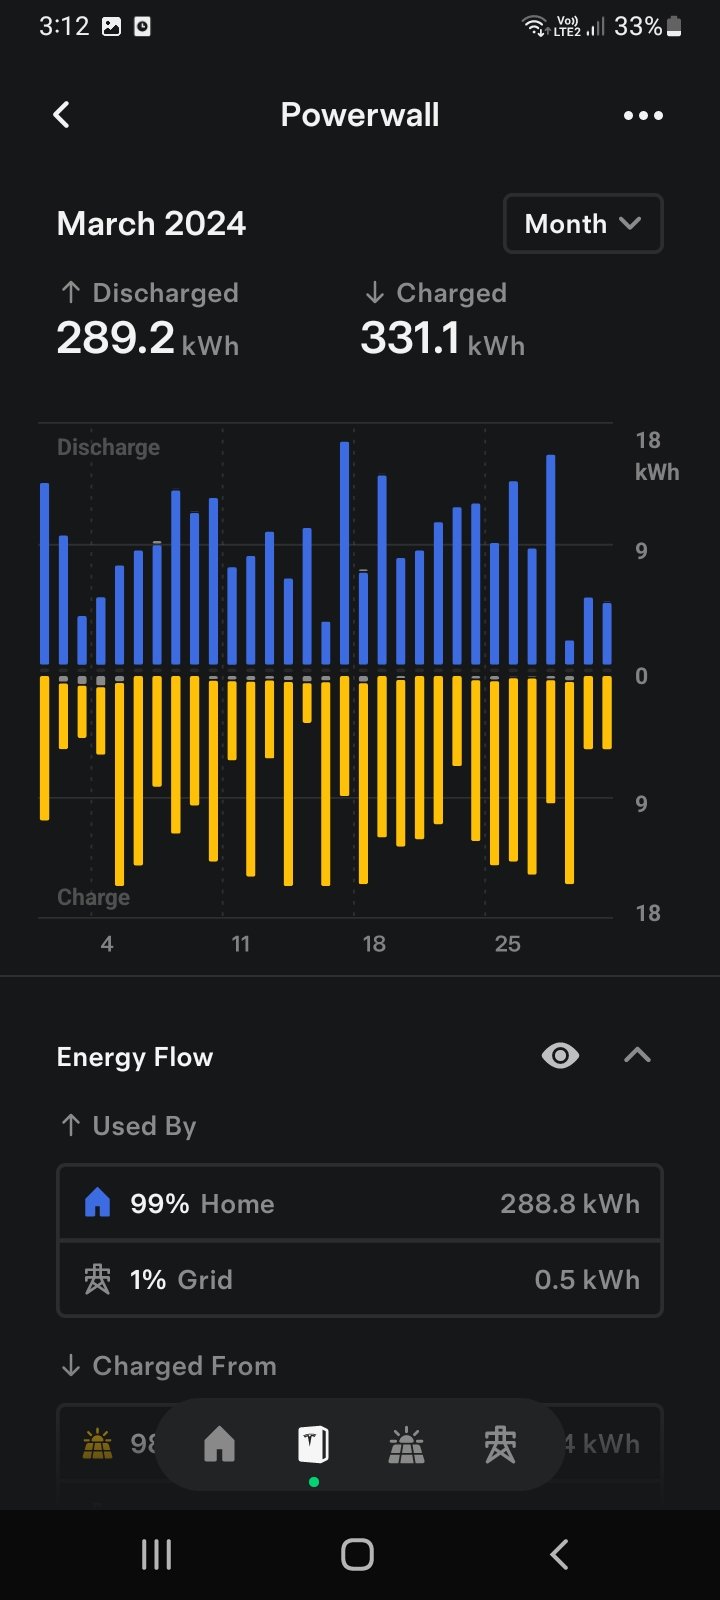
These graphs show the powerwall battery and where its power comes from and where is discharges that power to, incoming solar outgoing house.
So that has been the last 2 months and i must do an annual breakdown since it's been a year since we got the system.
⚡🪫☀️⚡🪫☀️⚡🪫☀️⚡🪫☀️
Here are the last 5️⃣months to catch you up on the action.
- https://steemit.com/hive-185836/@kiwiscanfly/october-solar-stats
- https://steemit.com/hive-185836/@kiwiscanfly/september-solar-stats
- https://steemit.com/hive-185836/@kiwiscanfly/november-solar-stats
- https://steemit.com/hive-185836/@kiwiscanfly/december-solar-stats
- https://steemit.com/steemexclusive/@kiwiscanfly/january-solar-stats
Thanks for reading my Solar post
all pics are mine
smudge approves this post
I am @kiwiscanfly 🥝🐔
Comments