Mastering Steem Market Volatility Using Bollinger Bands
2 comments
|
|---|
Hope you all are doing well and good and enjoying the best days of your life. This is me @shahid2030 from Pakistan and you are here reading my post. You all are welcome here from the core of my heart.
This is my participation in a contest Mastering Steem Market Volatility Using Bollinger Bands organized in SteemitCryptoAcademy by @crypto-academy .
Question 1: Explain the Components of Bollinger Bands. |
|---|
Bollinger Bands are the most popular technical analysis tool that we used to measure market volatility and identify potential trading opportunities. We generally have three main components of it. Let me describe them one by one.
1. Simple Moving Average (SMA):
The SMA line we typically set at 20 periods and it serves as the middle band of the Bollinger Bands.
It's function is to calculates the average price over a specified number of periods, for example a price of stock in the previous 15 days. It smooth out short-term price fluctuations and providing a clearer trend direction.
We can use SMA mostly for identifying the general direction of the price trend (it could be up, down, or sideways). Whenever we find the prices near the SMA, it can indicate a period of consolidation.
2. Upper Band:
The upper band is calculated by adding a set number of standard deviations (usually two) to the SMA. It represents a generally a two price levels; the one that is relatively high compared to the recent price range. It provides a visual measure of how far the price can stretch upward in a volatile market.In short it helps us to cope up with a volatile market.
Whenever the price moves near or above the upper band, it may indicate that the asset is overbought, here it works as a potential resistance or we expect a pullback in price here. However, strong breakouts above the upper band can also signal bullish momentum.
3. Lower Band:
The lower band somehow works same as upper band. It is calculated by subtracting the same number of standard deviations (usually two) from the SMA. It tells us a relatively low price level in the recent market or price range of a commodity, indicating potential support in a volatile market.
When the price moves near or below the lower band, it gives us a signal that the asset is oversold, Here we get signal that market is at support level or we can see bounce back from here. However, strong breakouts below the lower band can also indicate bearish momentum.
Analyzing Market Conditions with Bollinger Bands:
Volatility: We can findout volatility using bands.The bands expand and contract shows us actual volatility. Wider bands indicate higher volatility, while narrower bands signal lower volatility.
Trend Reversals: Price touching or moving outside the bands give us two indicatons, it indicates overbought or oversold conditions, suggesting potential reversals. However, a sharp moves along the bands may confirm a strong trend.
Trading Signals: A common Bollinger Band strategy is to trade the “bounce” when prices reach the bands, Here we expect a reversion to the mean. Here the traders most oftenly follow trends by looking for breakouts beyond the bands, especially when the market is in high volatility mood.
Question 2: Analyzing Market Conditions with Bollinger Bands |
|---|
This is STEEM/USDT chart on daily time frame. We have three lines in the Bollinger bands; the upper, middle and the lower one. Whenever the price touch the upper band it means overbought regions and we prediction a reversal in market from this position. It's mean we find short position from here.
The middle line as an average line and it shows us market is in consolidation phase or side way range. The lowest line is lower Bollinger band and it gives us prediction to take long position. It indicates that market will goes up from this position.
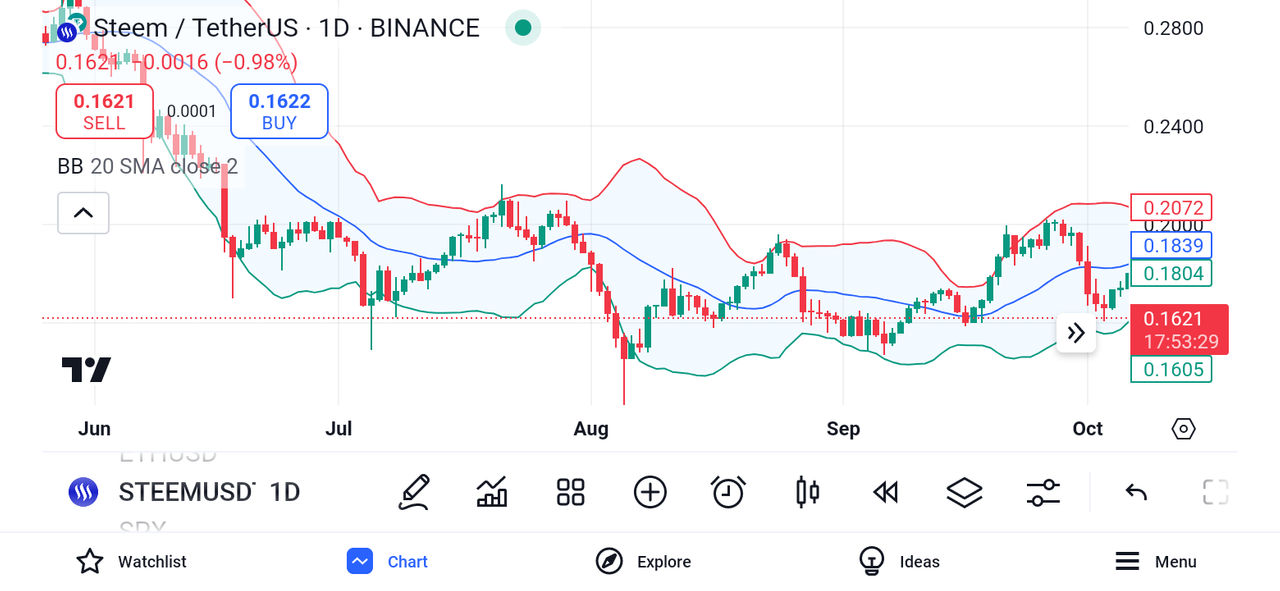
Now applying all these things to the practical chart. You can see whenever market has touched the upper band we have seen a down move in the market. In this chart it happened three times u may see it clearly. So it creates a short signal here for us.
The same when the market has touched the lower band we have seen upward movement in the market. It happened three times too in this chart. It is creating a long signal for us. We haven't seen a quite long movement of market near the average line and whenever market is moving side ways or consolidating we avoid taking entry.
Question 3: Identifying Volatility Patterns with Bollinger Bands |
|---|
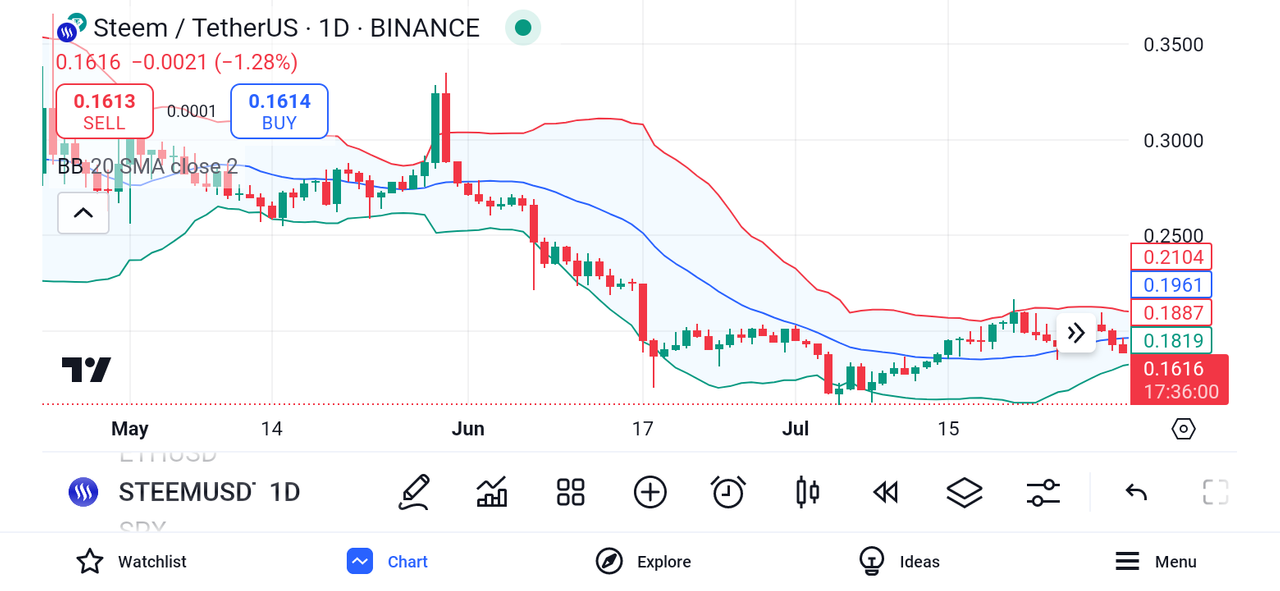
Bollinger bands sometimes shows us the perfect volatility in the market. Let me show through some practical charts. This is STEEM/USDT chart on daily time frame. We can see a sharp movement in Steem's price which is quite perfectly predicted by Bollinger bands indicator. The price penetrated upper band in upside direction and then the market as aspected took a very sharp move in downward direction. The seller may have printed too much dollars at that point.
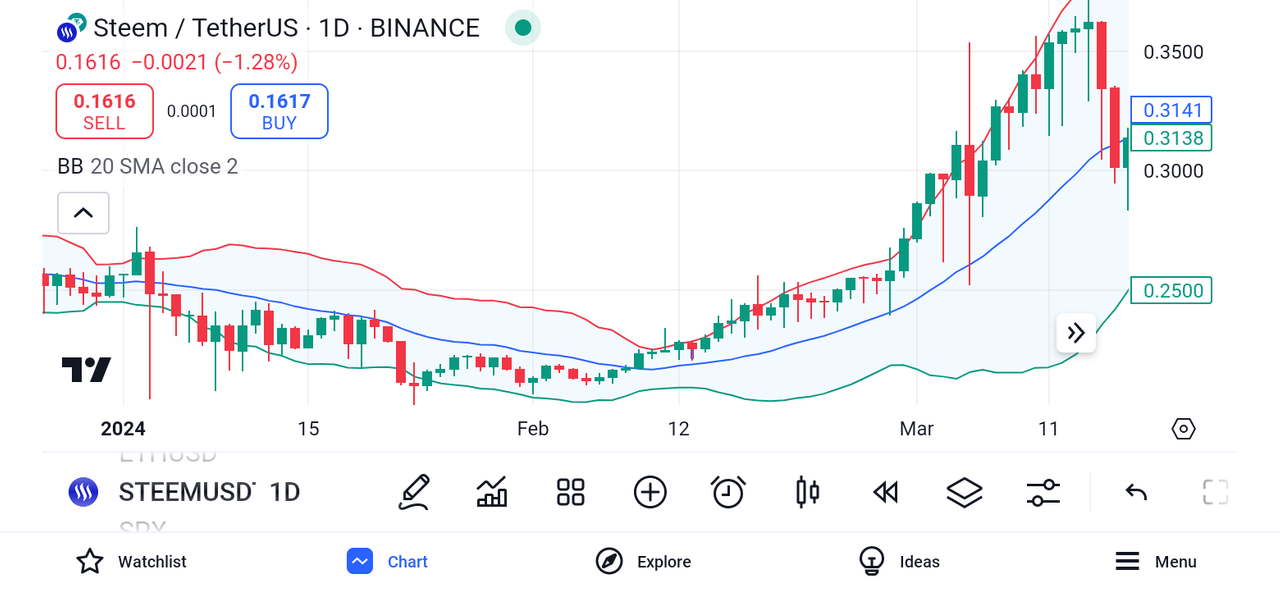
This is another STEEM/USDT chart on daily time frame. We can see a huge upraise movement in Steem's price. The price has touched the lower band and then a sharp upside movement as seen.
So in short Bollinger bands do predict any volatility that hit the market. Both these charts are the practical examples of it.
Question 4: Developing a Trading Strategy with Bollinger Bands |
|---|
I would add another indicator along with Bollinger bands which we called RSI. It gives us the perfect entery zones for our trades. Let's find out some perfect trades on STEEM/USDT pair using these two indicators.
STEEM/USDT pair on one hour time frame for Long position.
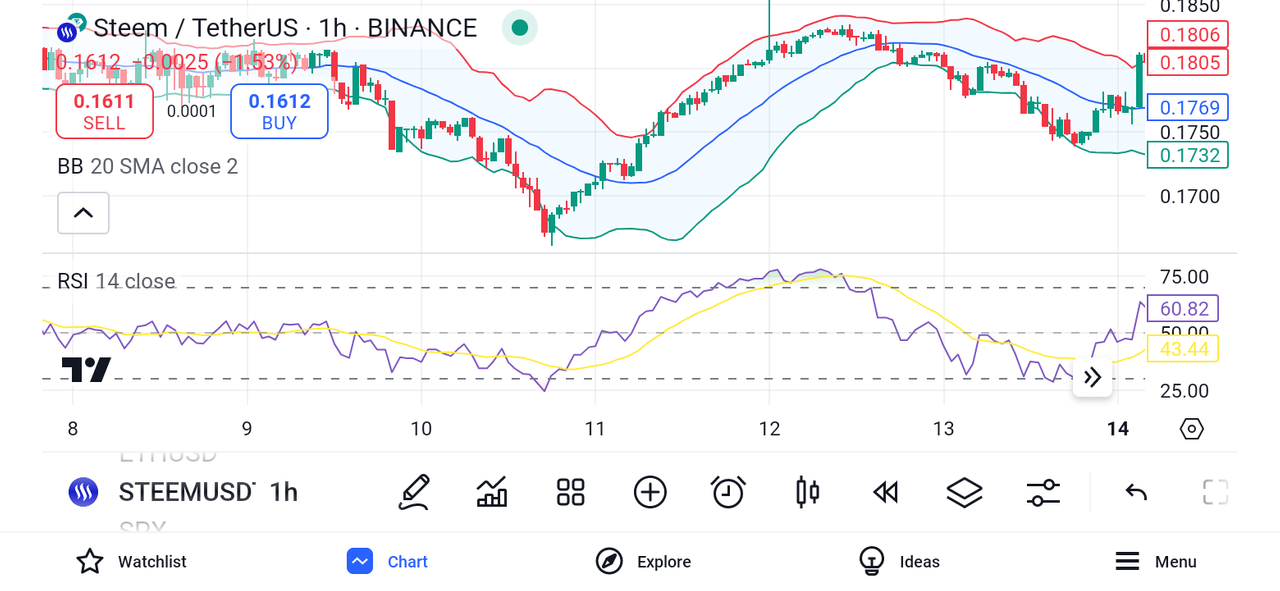
In this chart we can see price is at oversold region on both the indicators which is a solid induction of upward movement of market from this point. It is best long position point.
STEEM/USDT pair on one hour time frame for short position.
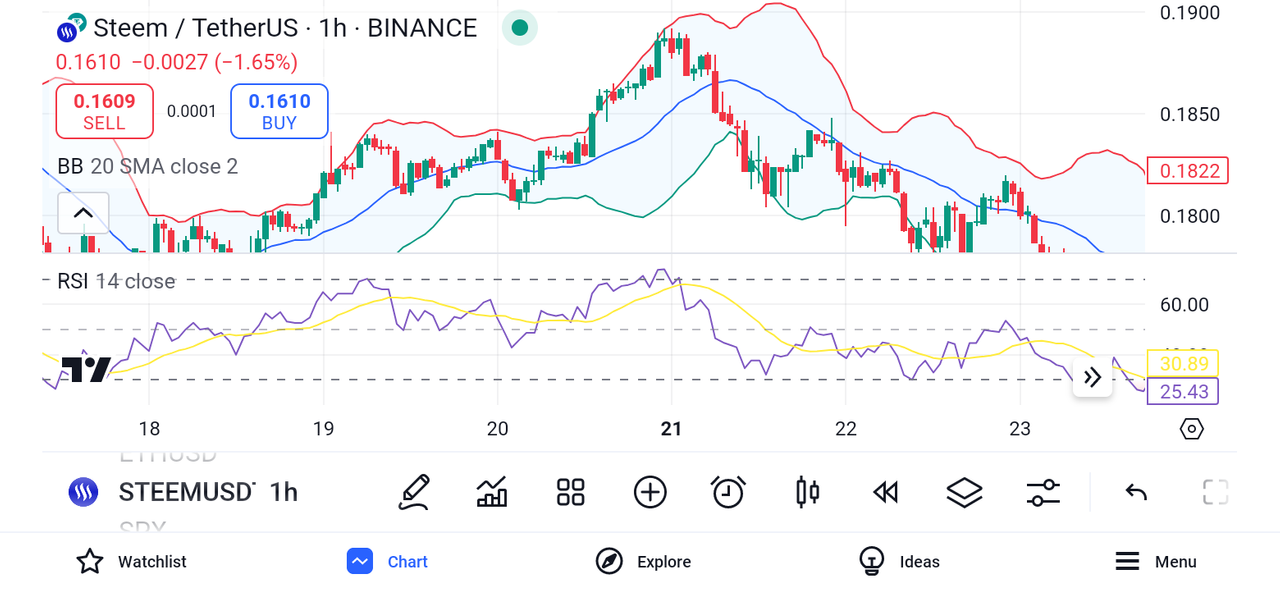
We can see here the market is an overbought region, which creates a perfect senerio for short position. Both the indicators touched the overbought region and a sharp down movement has been seen here. A perfect place for short position.
STEEM/USDT pair on four hour time frame for short position.
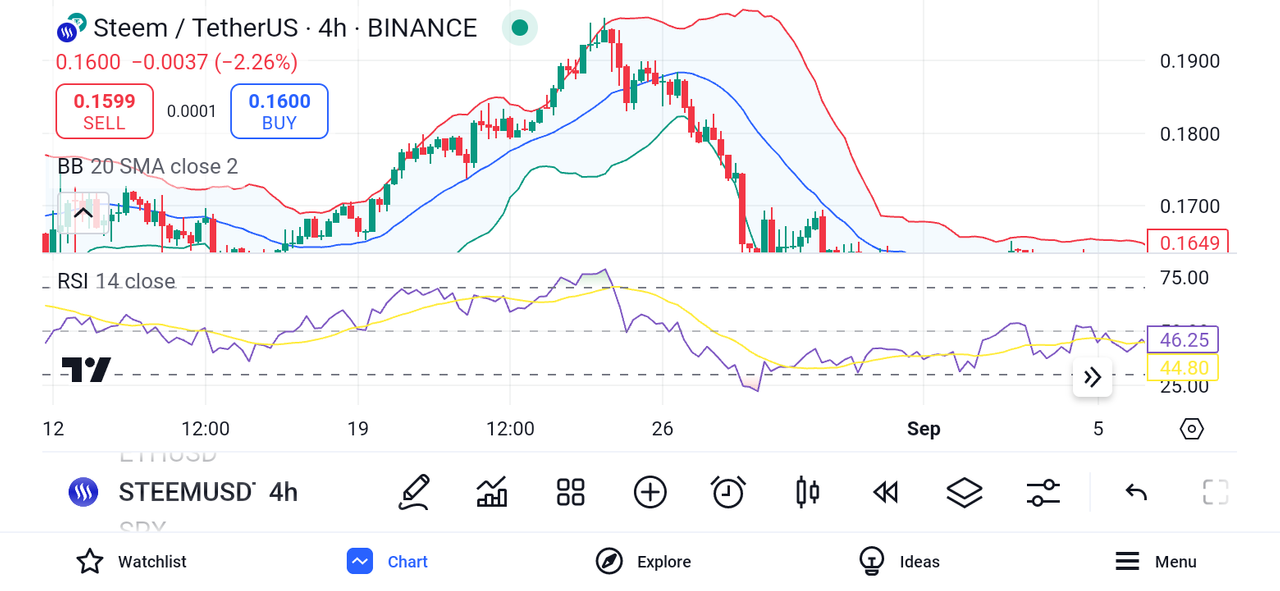
STEEM/USDT pair on four hour time frame for long position.
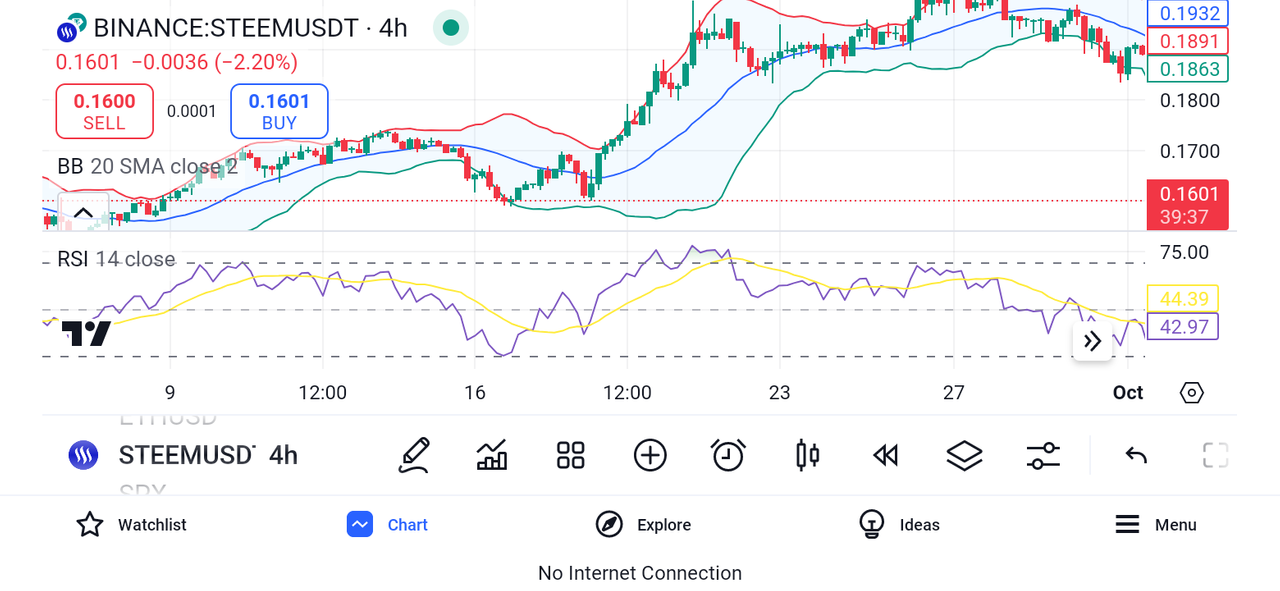
Question 5: Predicting Price Movements with Bollinger Bands |
|---|
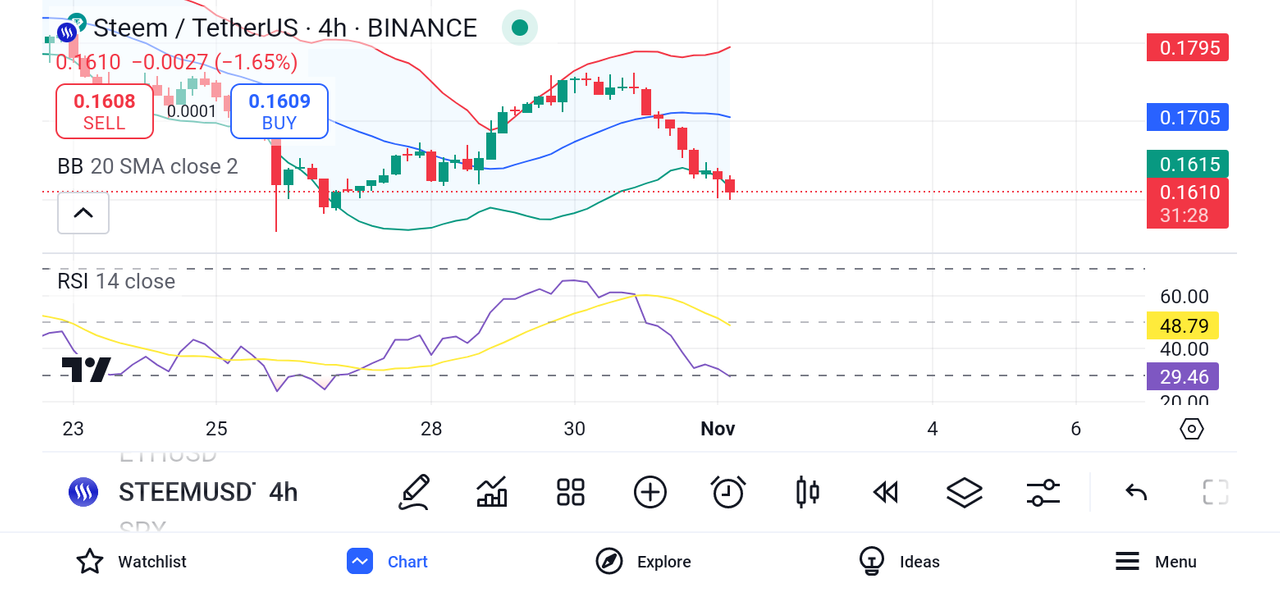
This is the current price of STEEM on four hour time frame. We can see it's on oversold region on both the indicators. It indicates the the market may take upside movement from this point. According to my analysis STEEM might go bullish from here.
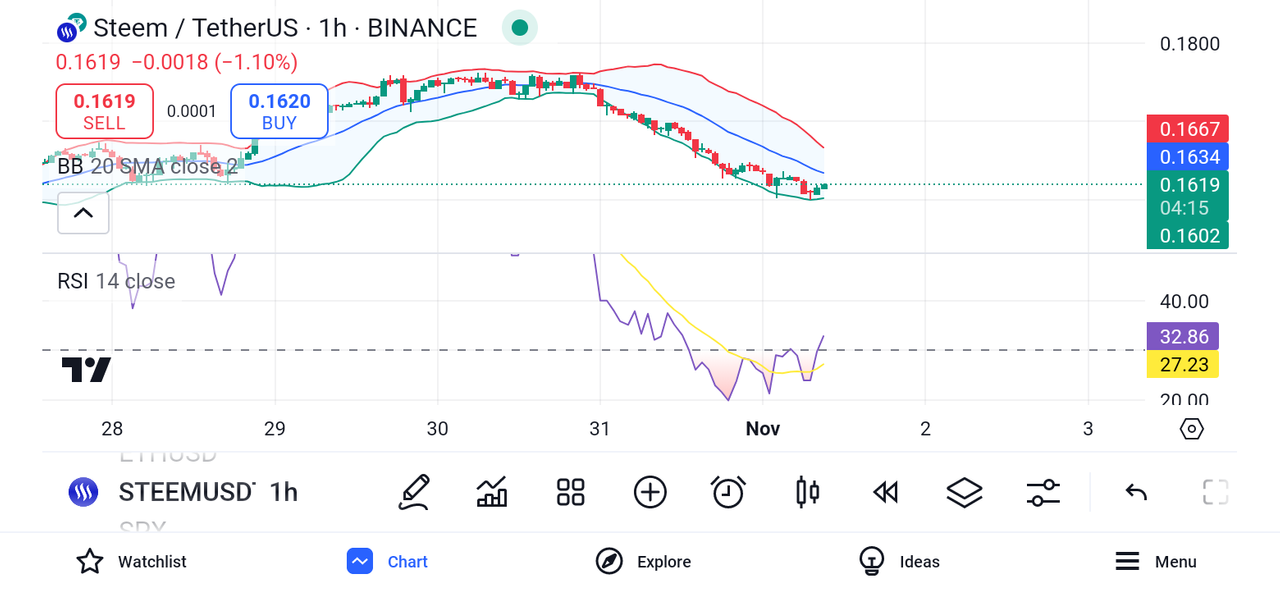
Look at the analysis of STEEM coin on smaller time frame which is one hour. It is also giving bullish indication on this time frame.
This is all about my blog for today, hope you guys have enjoyed reading it. See you soon with a new amazing and interesting topic, till take care.

| I would like to invite: @goodybest, @ripon0630, @beemengine, @tommyl33 to participate in this Contest |
|---|
Your presence here means alot
Thanks for being here
Regard shahid2030

Comments