"Mastering the Bull Run with Trailing Stop and Multi-Timeframe Analysis"
3 comments
Hello Everyone
This is @max-pro from, #Bangladesh
Assalamu Alaikum friends hope you all are well. By the grace of Allah I am also well. I always love participating in engagement contests. So today I came to participate in this "Mastering the Bull Run with Trailing Stop and Multi-Timeframe Analysis", wonderful learning contest organized by SteemitCryptoAcademy community. Here are some questions that I will answer in accordance with the topic of the contest. So let's begin.
 Made by Canva
| Question 1: Explain Trailing Stop and Its Usefulness in a Bull Run |
|---|
How Trailing Stop Works : A trailing stop is an order that you can use to hold a fixed profit in your trade. This is helpful to protect your profit as it will update the stop loss order when the trade price rises. But it doesn't work when prices fall. It automatically protects your profit when the price moves in the right direction.
Why Especially Effective In Bull Runs : Trailing stops help you protect part of the profit when the market price is up during bull runs. With this you can update the stop loss order so that you can enjoy the profit from the market upswing. But you won't lose your profit if the market drops suddenly.
Different types of trailing stops are shown :-
| Percentage-Based Trailing Stop | In this trailing stop you set the stop loss value of the trade by a certain percentage. For example, if you set a 5% trailing stop and the market rises 10%, the stop loss will move below 5% of your trade. |
|---|---|
| Specific Level Trailing Stop | It sets the trailing stop according to a specific point or price level. For example you can set a $100 point trailing stop. That means if the price rises by $100, the stop loss will move below that level. |
| ATR-Based Trailing Stop | ATR (Average True Range) is a technical indicator that measures market volatility. In ATR based trailing stop you set the stop loss according to market volatility. It protects your trades according to the market dynamics. |
| How They Protect Profits When Capturing Uptrends | 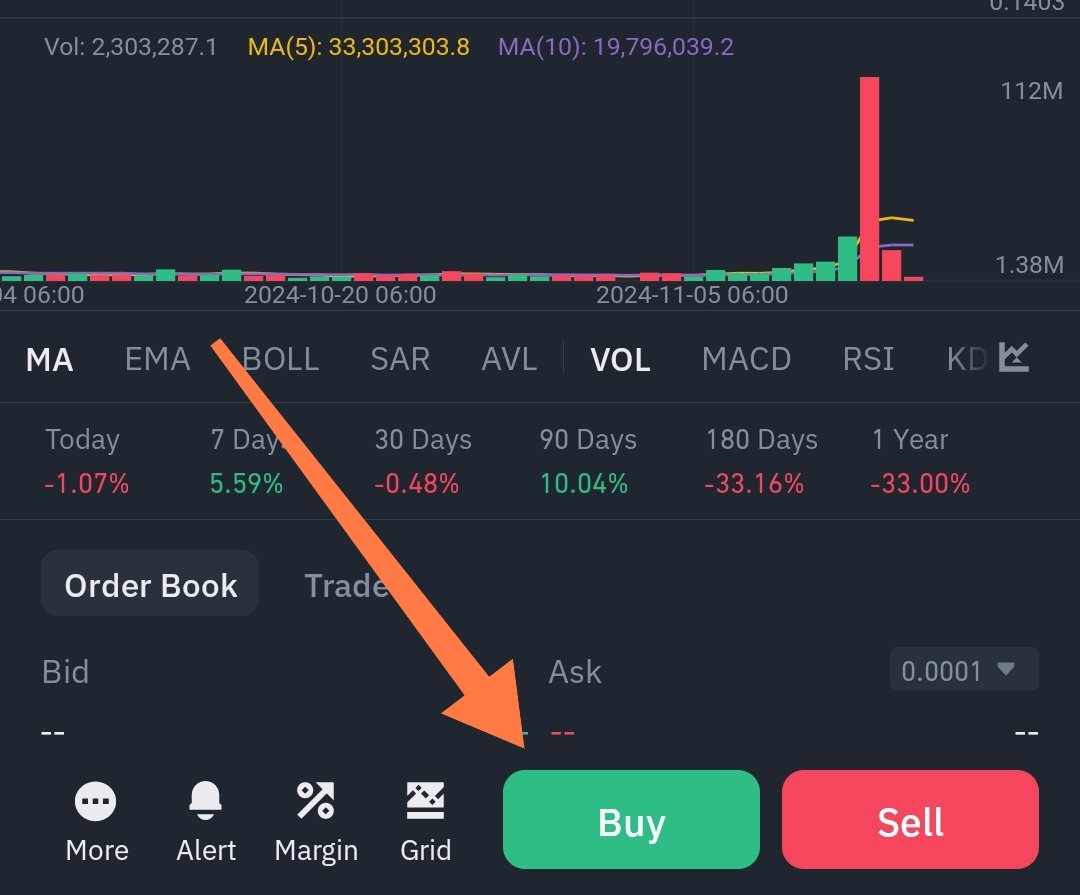 captured by @max-pro captured by @max-pro |
|---|
Trailing stops are particularly effective as they help protect profits. A trailing stop ensures that you don't lose part of the profit when you are trading in an uptrending market. Although the price may go down sometimes. This is an automatic method that allows you to catch market upswings but helps protect your profits when the price drops.
| Question 2: Multi-Timeframe Analysis for Steem’s Bull Run |
|---|
Multi-timeframe analysis is a technique where you observe trends and market conditions over multiple timeframes, so you can make more informed decisions. Doing this analysis on the Steem/USDT pair can complement your entry point, stop level and profit taking decisions by combining insights from different timeframes.
In case of weekly timeframe :-
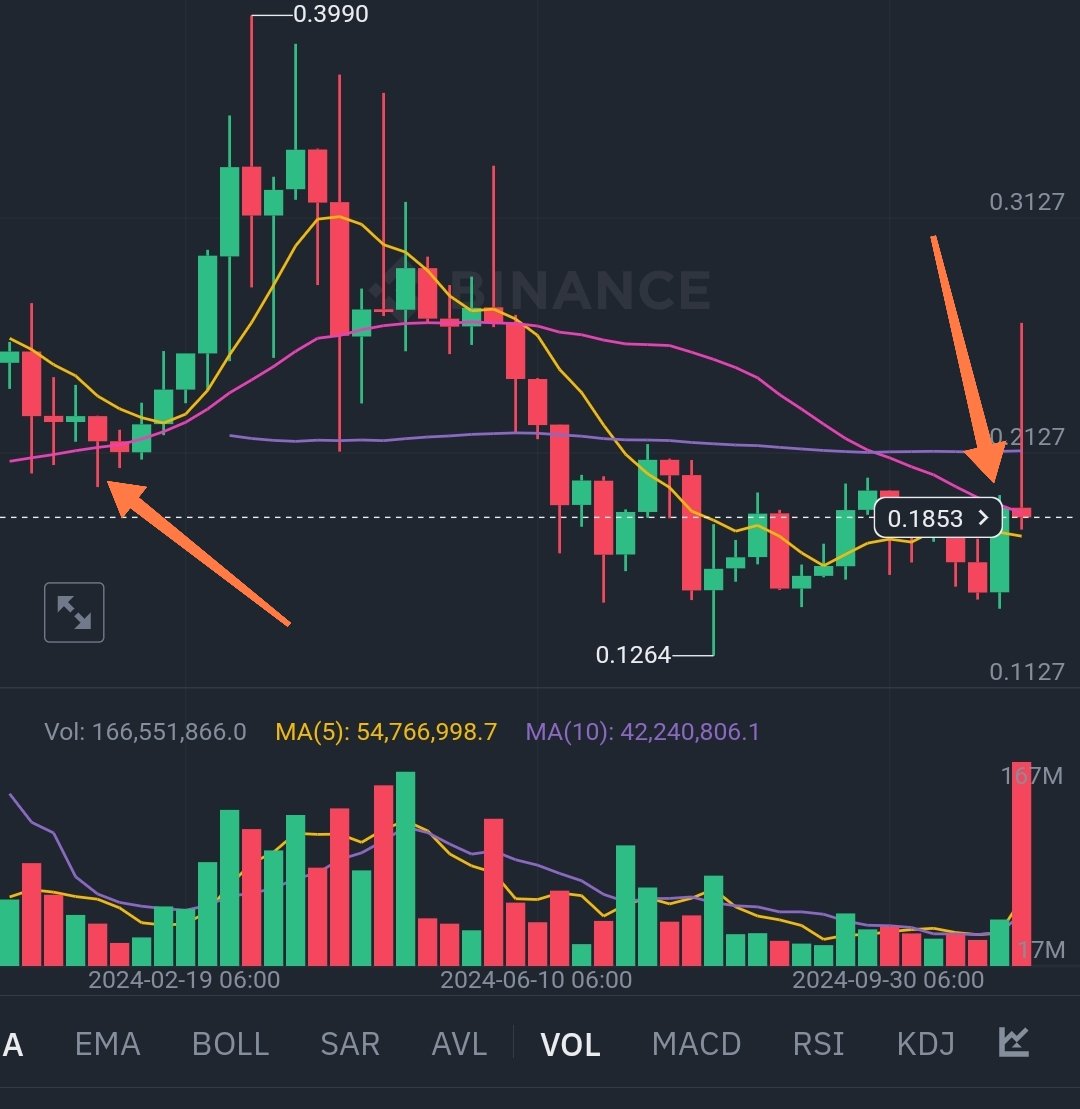 captured by @max-pro
| Trend Direction | Through the weekly chart we can understand the long term trend. Such as the main rise or fall of Steem/USDT. It indicates the biggest trends and is helpful for making decisions based on the main trend or trends. |
|---|---|
| Entry Point | On the weekly chart you can select an entry point near a strong support or resistance level after confirming the direction of the trend. |
| Stop Level | If the trend looks strong on the weekly timeframe, the stop loss level should be placed far enough away. So that it does not go against the main trend of the trade. |
| Profit Taking | Through weekly analysis we can set long term goals. The profit taking point can be based on the long term trend. |
In case of Daily Timeframe :-
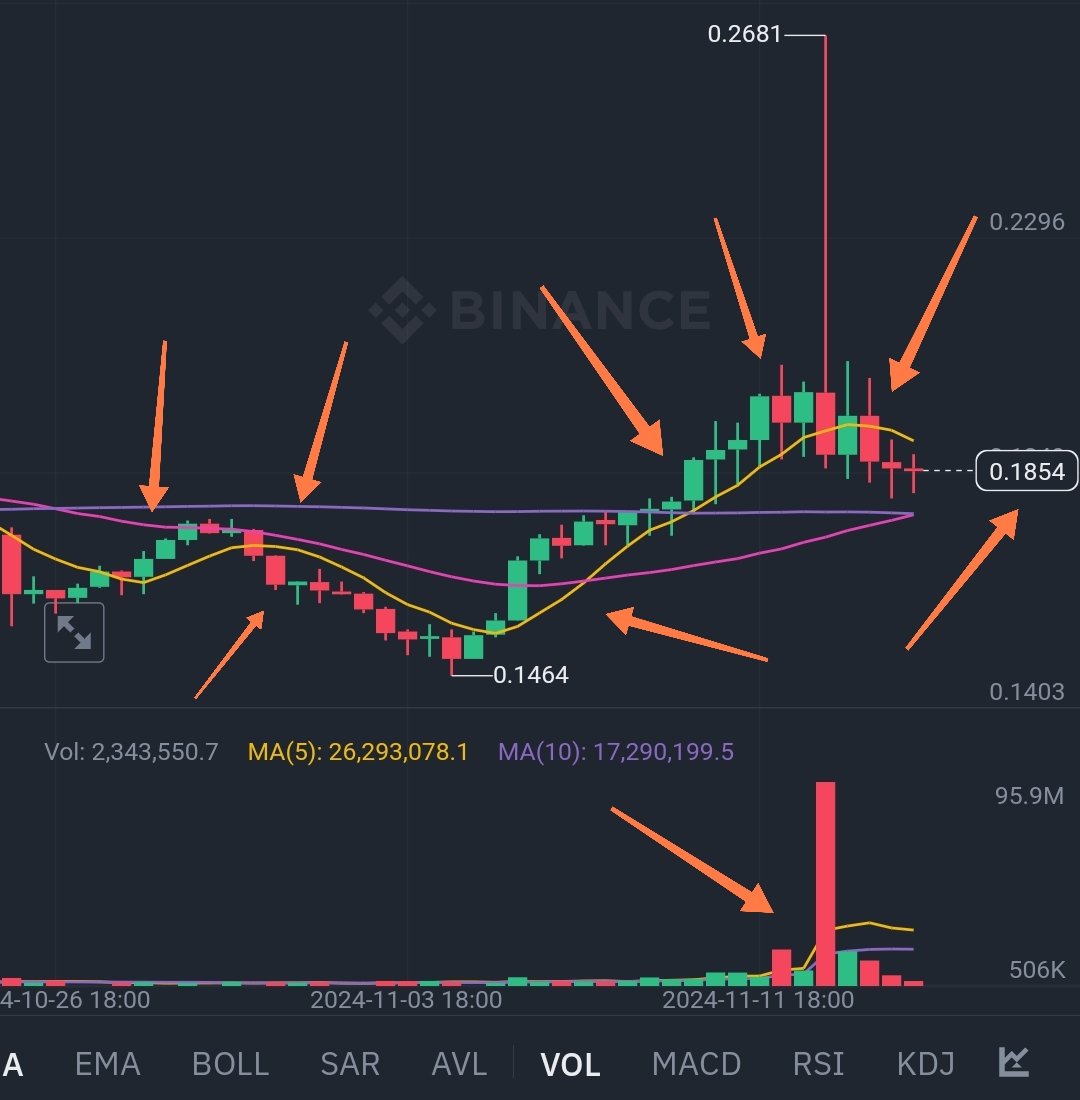 captured by @max-pro
| Trend Direction | On the daily chart you can observe more minor trends and upward or downward trends. It gives you medium term trend guidance. |
|---|---|
| Entry Point | On the daily chart, we can see close support and resistance levels. Where we can get a sure entry point. You can filter data such as daily high/low movement. |
| Stop Level | The stop level on the daily timeframe is usually adjusted to minimize risk between trades. If the entry point is too close, you can increase the profit potential by placing the stop loss level a bit further. |
| Profit taking | With the daily chart you can set some targets for taking profits, such as reaching key resistance or support levels. |
In case of Hourly Timeframe :-
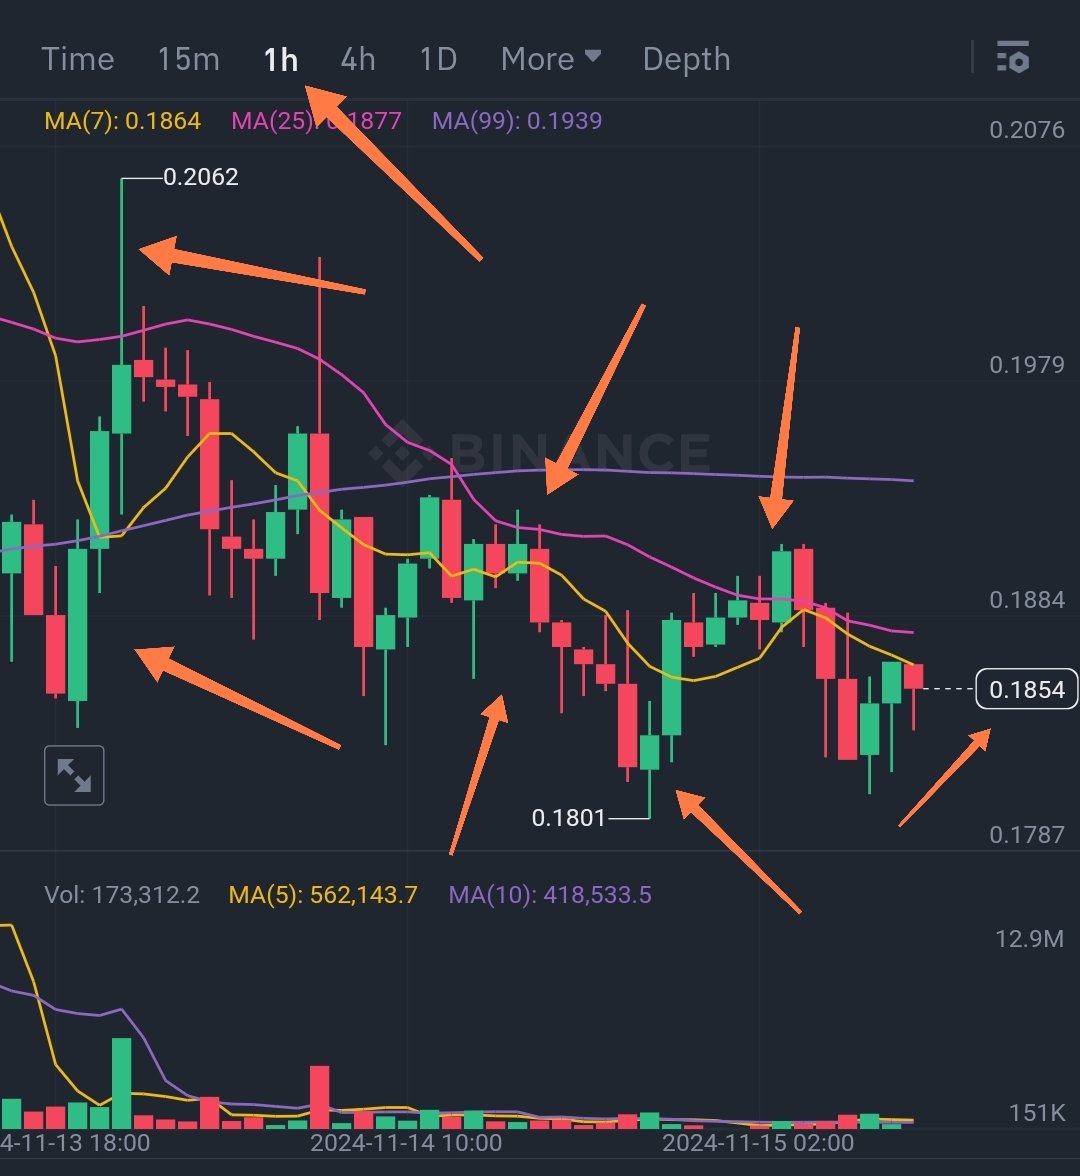 captured by @max-pro
| Trend Direction | On the hourly chart we can see short-term trend and dynamics of price changes. It helps to understand the initial volatility in the trade and subsequent trend reversal moments. |
|---|---|
| Entry Points | On the hourly chart you can identify very specific entry points. This helps you react quickly to market reversals. |
| Stop Level | To capture short-term market volatility, stop losses are usually set closer on hourly timeframes, to control the amount of losses. |
| Profit Taking | On the hourly chart, you can make quick profit taking decisions, such as reaching the next support or resistance level. |
| Question 3: Adjusting Trailing Stops Based on Multi-Timeframe Analysis |
|---|
 made by canva
Adjusting trailing stops based on multi-timeframe analysis can make your trading strategy more effective. Adjusting trailing stops using insights from different timeframes will help you protect profits and control risk during price swings. Here is the explanation of how to adjust the trailing stop according to each timeframe.
The weekly timeframe indicates the major direction of the trend. Using this you can set trailing stop for long term trades. Trailing stops are usually set at large ranges based on weekly charts. For example you can adjust using ATR (Average True Range) so that the stop loss moves according to the normal market movements.
- Example - If a strong trend is seen on the weekly chart, the trailing stop can be set below the recent support level.
The daily timeframe is helpful in monitoring medium-term trades and minor trend changes. Trailing stops are placed closer together on daily charts. For example, you can adjust the trailing stop by targeting the daily high and low price so that you can protect part of the profit.
- Example - If a new high is formed on the daily chart, the stop loss can be updated below the new support level.
The hourly timeframe is useful for short-term trading and monitoring volatility. Stop losses on hourly charts are updated quickly, allowing for quick profit protection during small price fluctuations. You can use a small percentage-based or fixed point trailing stop here.
Example - If the market is moving up quickly on the hourly chart, you can update the stop loss quickly, i.e. below each hourly close price.
Overall Strategy
Use the Weekly Timeframe to make large adjustments to stop losses focusing on major trends.
Use the Daily Timeframe to adjust the trailing stop for medium term profit protection.
Use the Hourly Timeframe to update stop loss quickly at the end of a trade or in volatile markets.
In this way, using information from each level of multi-timeframe analysis, you can set trailing stops that protect trade profits and minimize the risk of losses.
| Question 4: Develop an Advanced Trading Strategy for a Bull Run |
|---|
 made by canva
I will try to answer this question very simply. To create a simple and effective bull run trading strategy follow the following steps.
Trend Identification :- Observe the Daily Chart. If the price is above the 50 EMA (Exponential Moving Average) and rising steadily, it indicates an uptrend. Use RSI. If the RSI is above 50 and rising steadily, not near 70, the trend is strong.
Select Entry Point :- Identify entry points when there is a small Pullback or a slight drop in price. This ensures that you avoid buying at a high price. Observe Support Level or Fibonacci Retracement eg 38.2% or 50%.
Setting Stop Loss :- Set the stop loss slightly below the last support level. It helps in risk management. You can set the stop loss level using ATR (Average True Range), to adjust to normal market volatility.
Profit Taking Objective :- Profit target can be 1.5 or 2 times previous Resistance Level or original price movement. For example, if you take a risk for a 10% profit, you can accept a 15% or 20% profit. Trailing Stop can be used, so that the profit is automatically protected during the upward trend of the market.
Monitoring Regular Updates :- Monitor news and economic data that may affect the market. Use multi-timeframe analysis (eg weekly and daily charts) to understand the larger perspective.
As an example strategy is given,
| Identify Trend | Look for price above 50 EMA and RSI above 50 on the Steem/USDT chart. |
|---|---|
| Select Entry Point | Buy when a pullback occurs and touches the 50 EMA. |
| Set Stop Loss | Below the last support level. |
| Take Profit | Increase profit by next resistance level or Trailing Stop. |
This strategy is simple and effective during bull runs as it follows the trend and uses stop loss and trailing stop to secure profits.
| Question 5: Precautions and Limitations of Trailing Stops and Multi-Timeframe Analysis |
|---|
 made by canva
Both trailing stops and multi-timeframe analysis are useful in trading. But they have some caveats and limitations. Below I have shown them step by step.
Cautions and Limitations of Trailing Stops :-
| Market Volatility | Trailing stops can activate too early during high market volatility, which can force you out of a trade unexpectedly, even if the underlying trend is correct. |
|---|---|
| Challenges in determining the correct setting | Determining the percentage or point of trailing stop can be difficult. Setting it too close can cause the trade to close out quickly, and setting it too far away reduces profit protection. |
| Profits are limited at the end of the trend | Trailing stop may be unable to hold the maximum profit on a sudden change in the trend, especially if the market moves quickly in the opposite direction. |
Regarding the caveats and limitations of multi-timeframe analysis :-
| Confounding Signals | Different signals may be available on different timeframes. For example, a daily chart may show a bullish (upward) trend, but an hourly chart may have a bearish (downward) signal. There is a risk of confusion and wrong decisions. |
|---|---|
| Time consuming analysis | Analyzing multiple timeframes can be time consuming and requires more expertise. Not all traders can do this analysis properly. |
| Missing trend changes | Making decisions based on long-term timeframes can lead to missing important short-term trend changes, which can affect trade results. |
General precautions to be taken :-
Use trailing stops and multi-timeframe analysis to customize your trading strategy and ensure realistic risk management.
Mismatching multiple timeframes and not properly adjusting trailing stops can lead to unexpected losses.
Keeping these limitations in mind and using them with proper planning can make trading strategies more effective and profitable. So trailing stop and multi-timeframe analysis helps to secure profit and take right decision in trading.
However, they have some limitations, including overactivation during periods of instability, confusing signals, and challenges in determining the correct setting. These can be implemented using proper planning and risk management. This is a very good learning contest. I am very happy to participate here.
So I am Inviting my lovely Steemian friends @patjewell, @sushanta83, @kouba01 to Participate in this Competition.

Comments