Mastering Steem Market Volatility Using Bollinger Bands [UA/EN]
3 comments

| UA original |
|---|
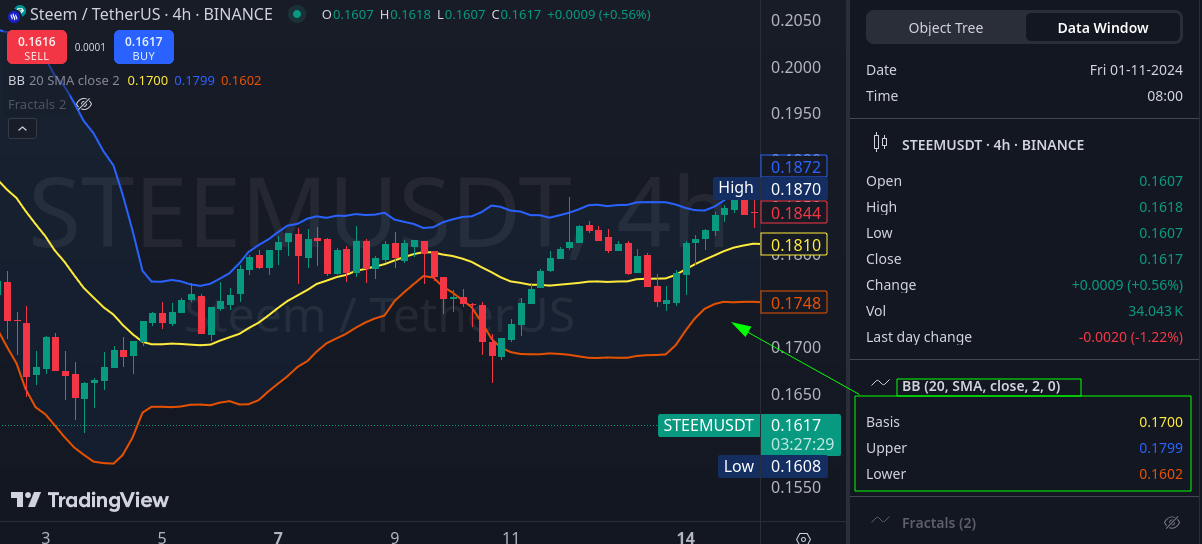
Лінії Болінджера це простий індикатор для швидкого визначення ситуаціях на ринку та в якій фазі він перебуває. Тож йому під силу флет, визначення тренду і навіть підказка про його зупинку чи розворот. Базується на Простих Середніх (SMA), точніше їх три. Стандартне значення середньої лінії має період 20, а верхня це проєкція середньої зміщеної на +2 вгору. Нижня відповідно на -2 вниз.
Сучасні рішення індикатора можуть мати простіше налаштування, де є лише один показних зміщення, наприклад 2, що задає зміщення відразу для двох ліній - верхньої та нижньої. Також можна змінювати тим MA, тобто обирати інший тим статичних даних, як-то EMA.
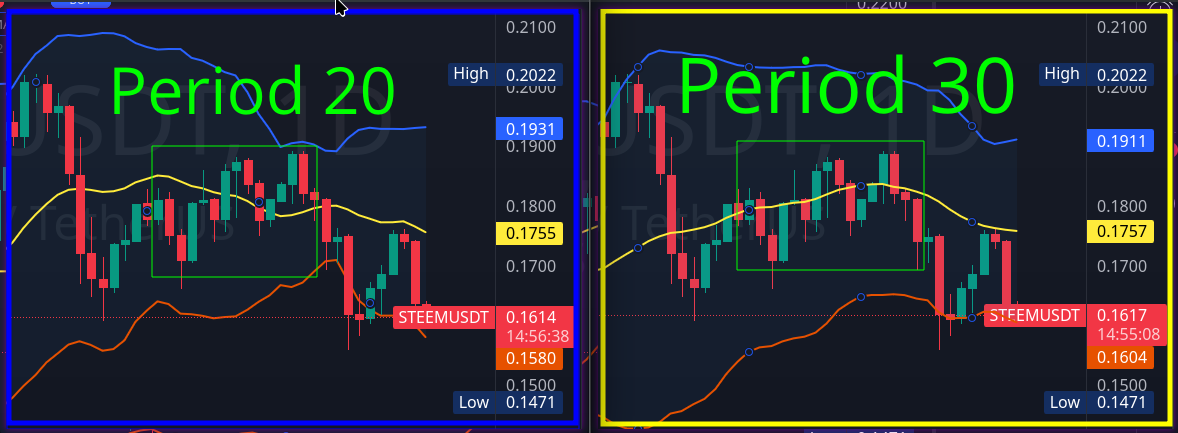
Це означає, що стандартний період 20 враховує на часовому періоді D1 майже весь робочий місяць, бо є вихідні субота та неділя. Ринок критовалют працює 24/7, тож можливо варто брати до уваги період 30.
Зображення вище, добре показує, що період 20 більше вказує на невизначеність ринку, в той час, коли 30, більше схильний до ведмежого настрою, адже ціна не подолала середню лінію.
Варіанти розпізнавання поведінки ринку
Висхідний тренд
Консолідація ціни накопичується переважно між середньою та верхньою лініями. Тобто мінімуми відштовхуються від середньої, а максимуми знаходять опір від верхньої.
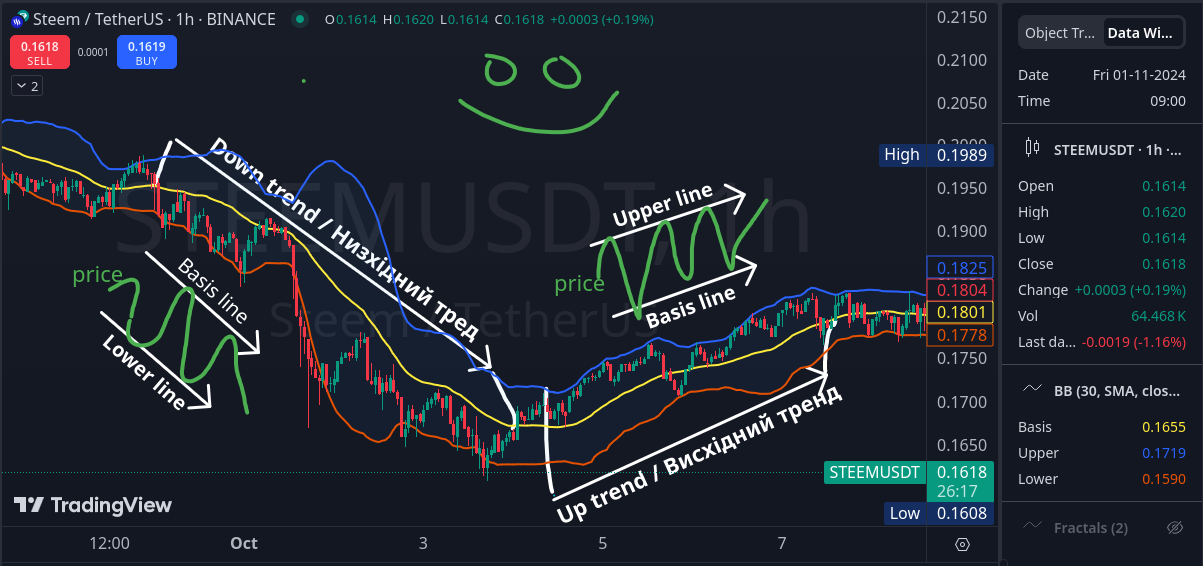
Низхідний тренд
Протилежно до висхідного, низхідний тренд займає положення між нижньою та середньою лініями. Мінімуми знаходять підтримку на нижній лінії, а максимуми відбиваються від середньої.
Ренж Флет і все що йде в бік
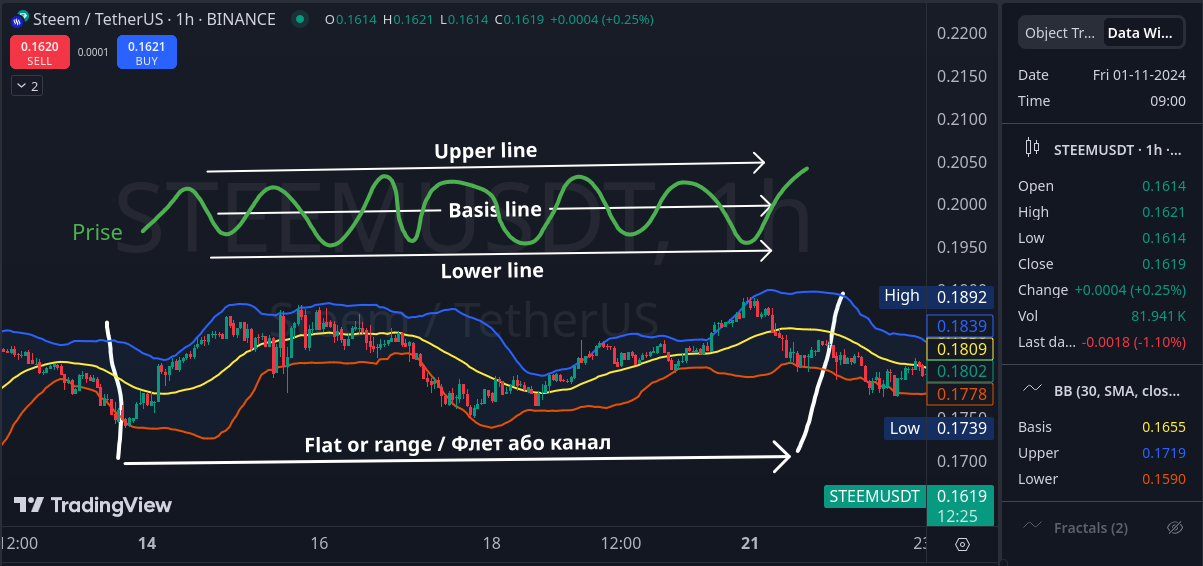
Ціна бродить у каналі. Відбиваючись від нижньої лінії - підтримки, та верхньої - опору.
Зупинка або розворот тренду
Коли ціновий діапазон зростаючого тренду середня-верхня лінія або спадаючого середня-нижня лінії, змінюється перетином середньої й дотиком до наступної після неї. Що може означати про призупинення направленого руху в цьому напрямку й перехід до корекції або розвороту.
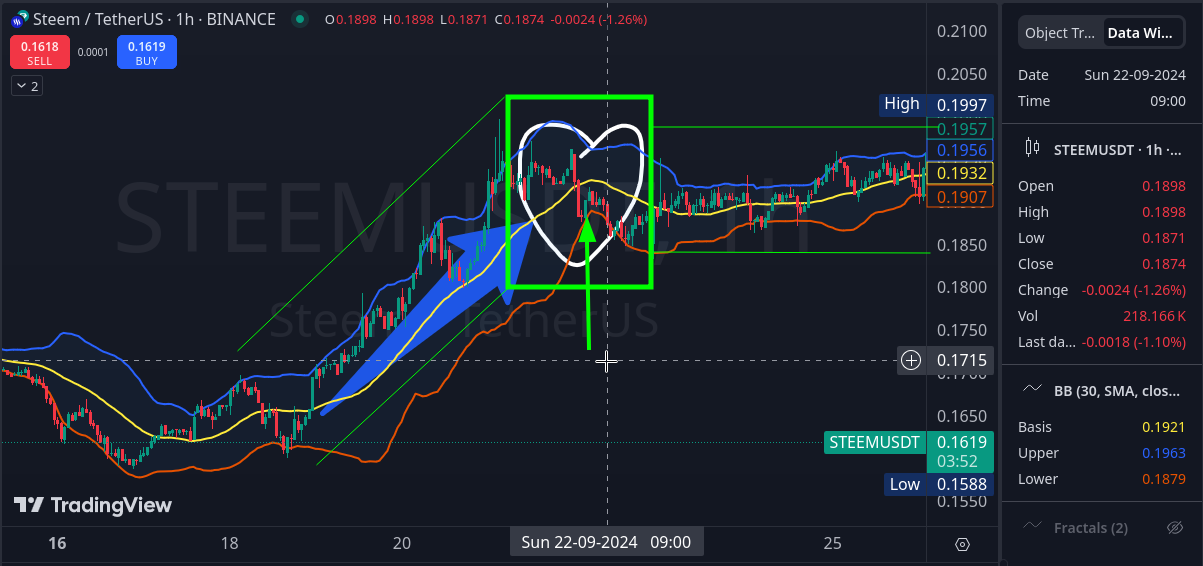
Висхідний тренд, потім перетин середньої лінії зверху вниз із дотиком до нижньої. Потім продовжується боковий рух.
Аналогічно до ситуації із висхідним трендом, як згадано вище, тільки перетин базової лінії знизу вгору.
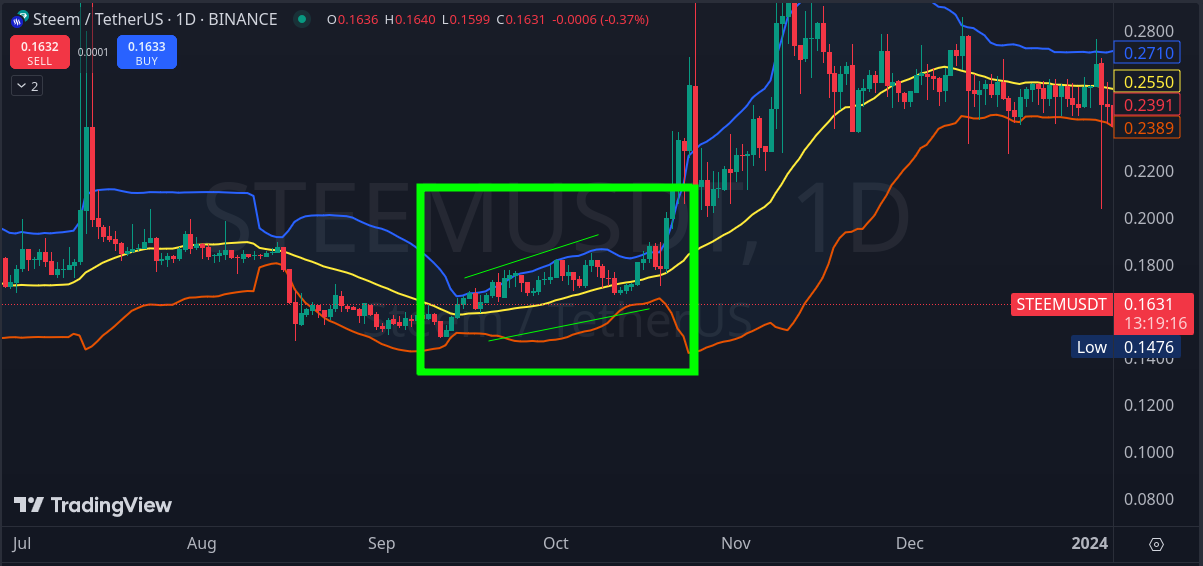
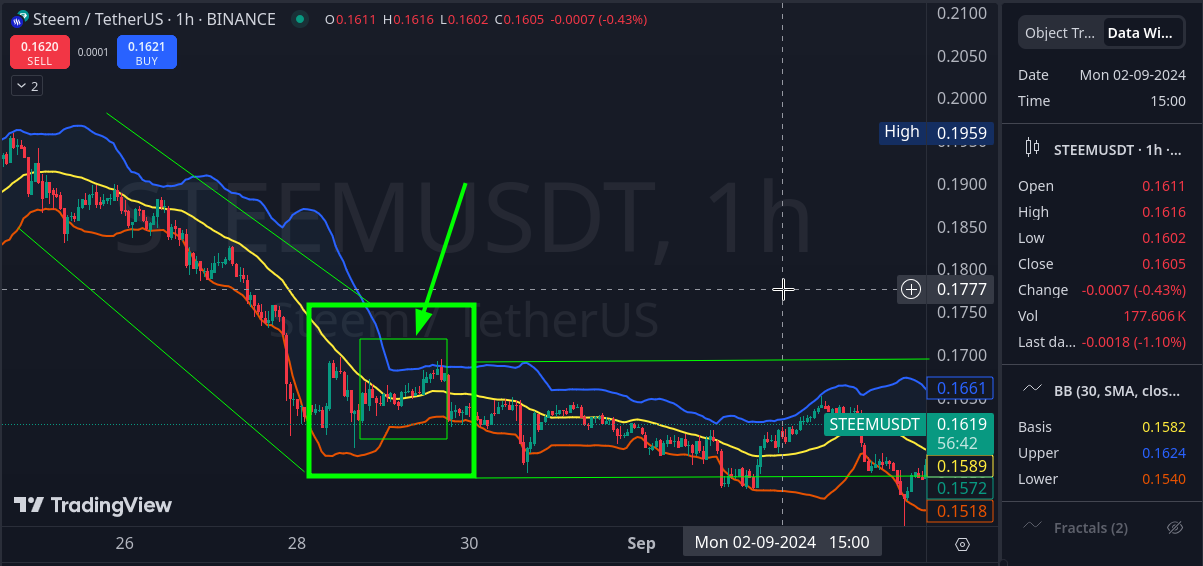
Звуження - ще одна цікава ознака, що наближається зміна ситуація на ринку. Коли волатильність знижується й накопичується, а Лінії Болінджера теж стають значно вужчими відносно попереднього періоду, тоді зростають шанси, що скоро буде прорив в одну зі сторін.
Розворотні патерни
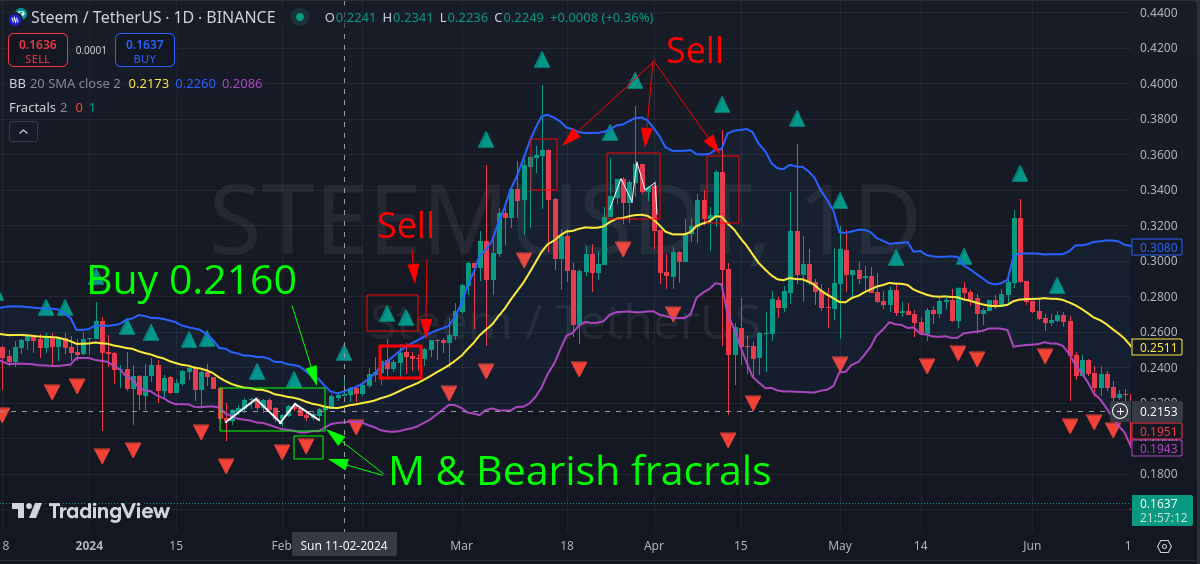
Сам по собі індикатор дає не такі сильні сигнали, щоб вони давали багато шансів на успіх, тому додається іще один фільтр - фігури технічного аналізу. Це прості формації типу M та W, котрі можуть бути вершинами або основами на підтримці. Найкраще коли вони утворюються під час зупинки або розвороту тренду, між верхньою та нижньою лініями індикатора Лінії Болінжера. Слабшими будуть утворені між середньою лінією та однією із крайніх - нижньою чи верхньою, проте варто дивитись на умови.
Найпоширенішими є:
- "Потрійна вершина" W
Сильний сигнал, бо велика фігура поміж верхньою та нижньою лініями. Низхідний тренд був затяжним.
- "Потрійне дно" M
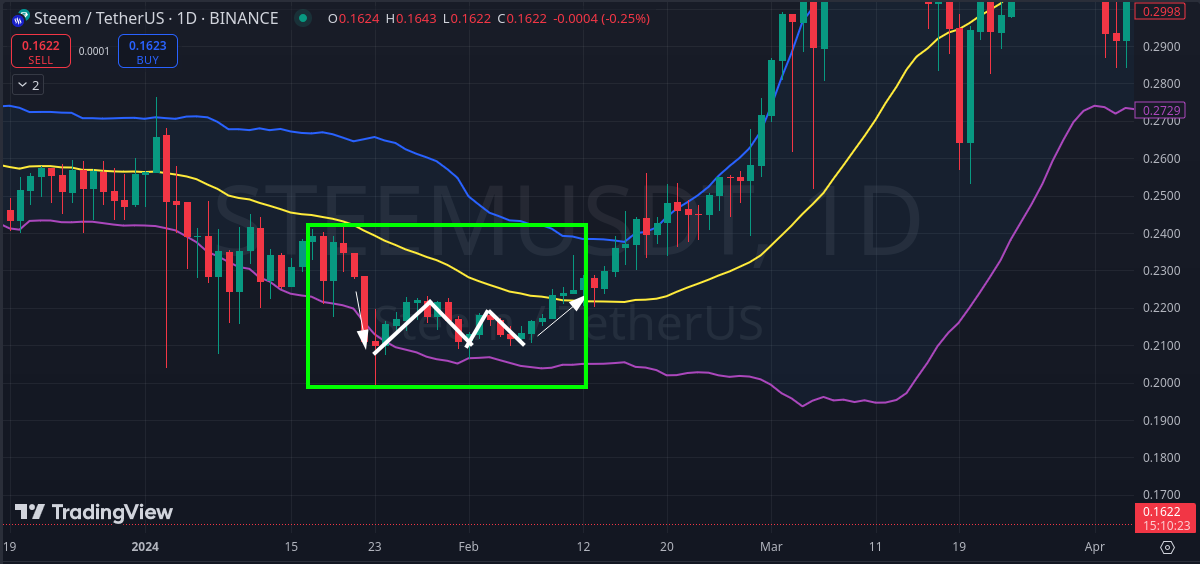
Фігура сформувалась і ціна швидко перетнула середню лінію знизу вгору. Теж був хороший висхідний тренд.
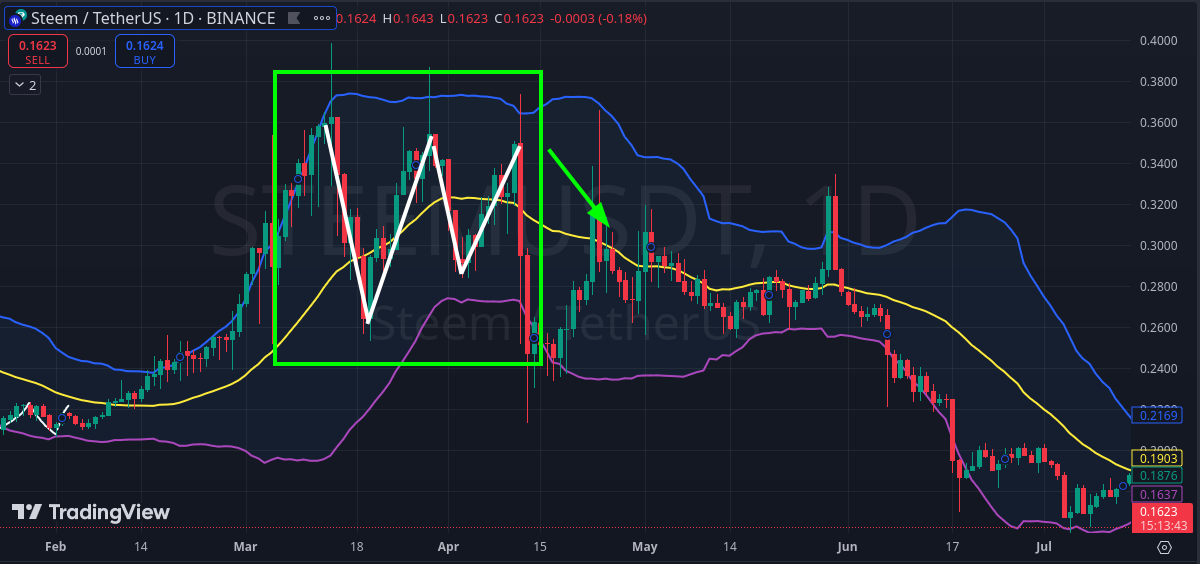
- "Подвійна вершина" M
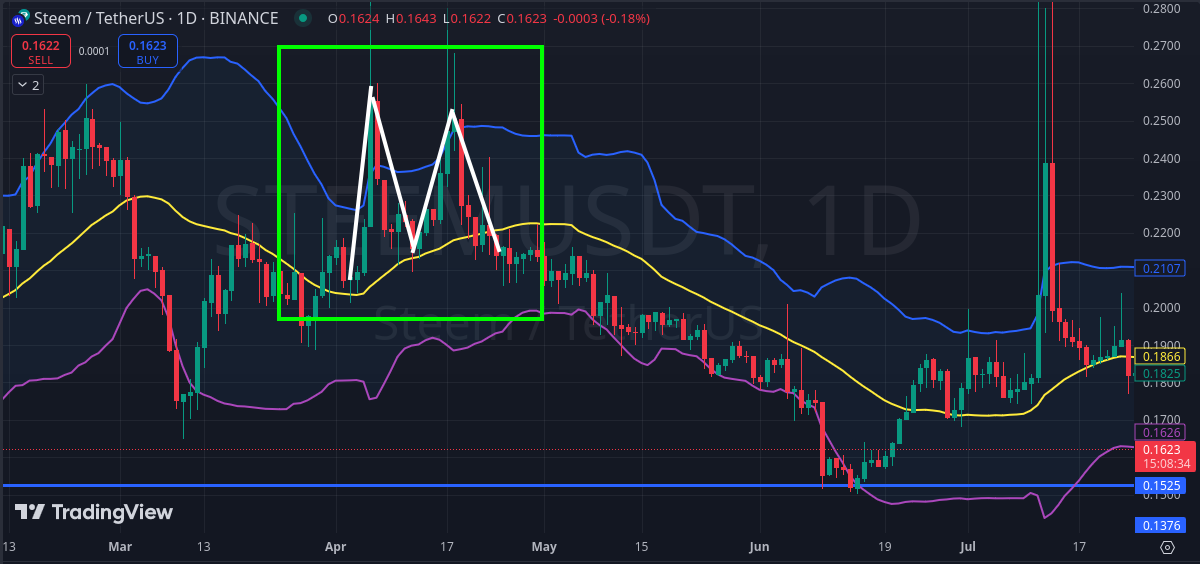
Величенька фігура, яка дала хороший ведмежий тренд.
- "Подвійне дно" W
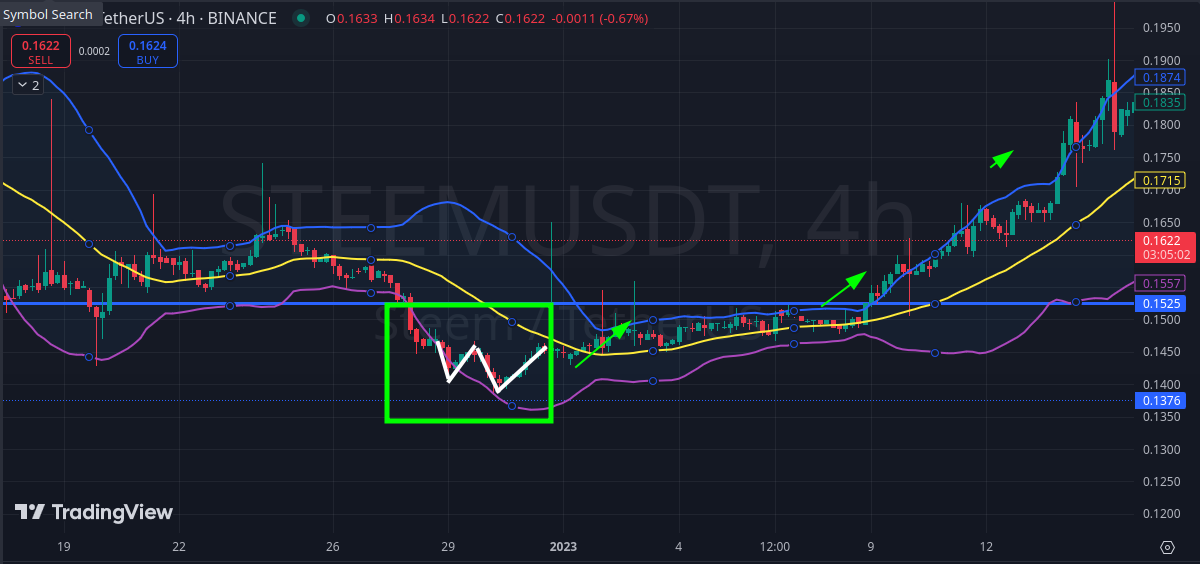
Слабенька фігура подвійного дна на меншому ТФ, дала підказку про бичачий рух, хоча він почався після затяжного періоду звуження, але нижче основи не ціна не опускалась.
Для початої цього має вистачити, бо часом найкраще працює те, що є простіше. Однак список цей не вичерпний, значно більше описано й класифіковано під назвою "Патерни M & W" - Артур Меріл. Тож майже скрізь, хоч і не згадується, а використовується в трейдингу та освітніх довідках. І Загалом глибше знайомство із книгами та іншими матеріалами, краще для засвоєння теоретичної частини, щоб брати до уваги інші деталі та додаткові індикатори із сімейства Болінджера і переводити це в практичну площину напрацювання досвіду.
Торгова стратегія для спот торгівлі STEEM/USDT із використанням індикатора Лінії Болінджера
Торгова пара: STEEM/USDT (та будь-які інші).
Складність: Трохи вище легкої.
Інструменти аналізу:
- Індикатор Лінії Болінджера;
- Фігури технічного аналізу M та W;
- Фрактали.
Часовий період: будь-який, але старші краще.
Умови для покупки (обмін USDT на STEEM із утримуванням у гаманці)
Вхід:
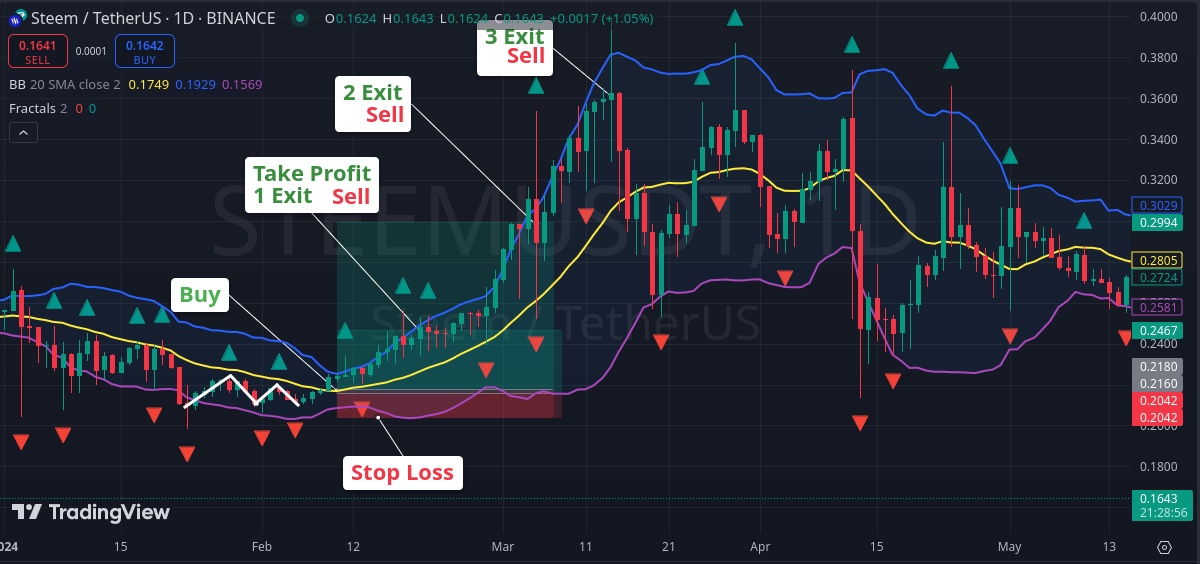
- Після низхідного тренду ціна гальмує, переходячи із положення середня-нижня лінія Болінджера, в накопичення консолідації, тобто флет. Формуючи в ньому розворотну фігуру як основу для підтримки. Додаткове підтвердження надасть утворення бичачого фракталу, що буде набагато краще.
Вихід:
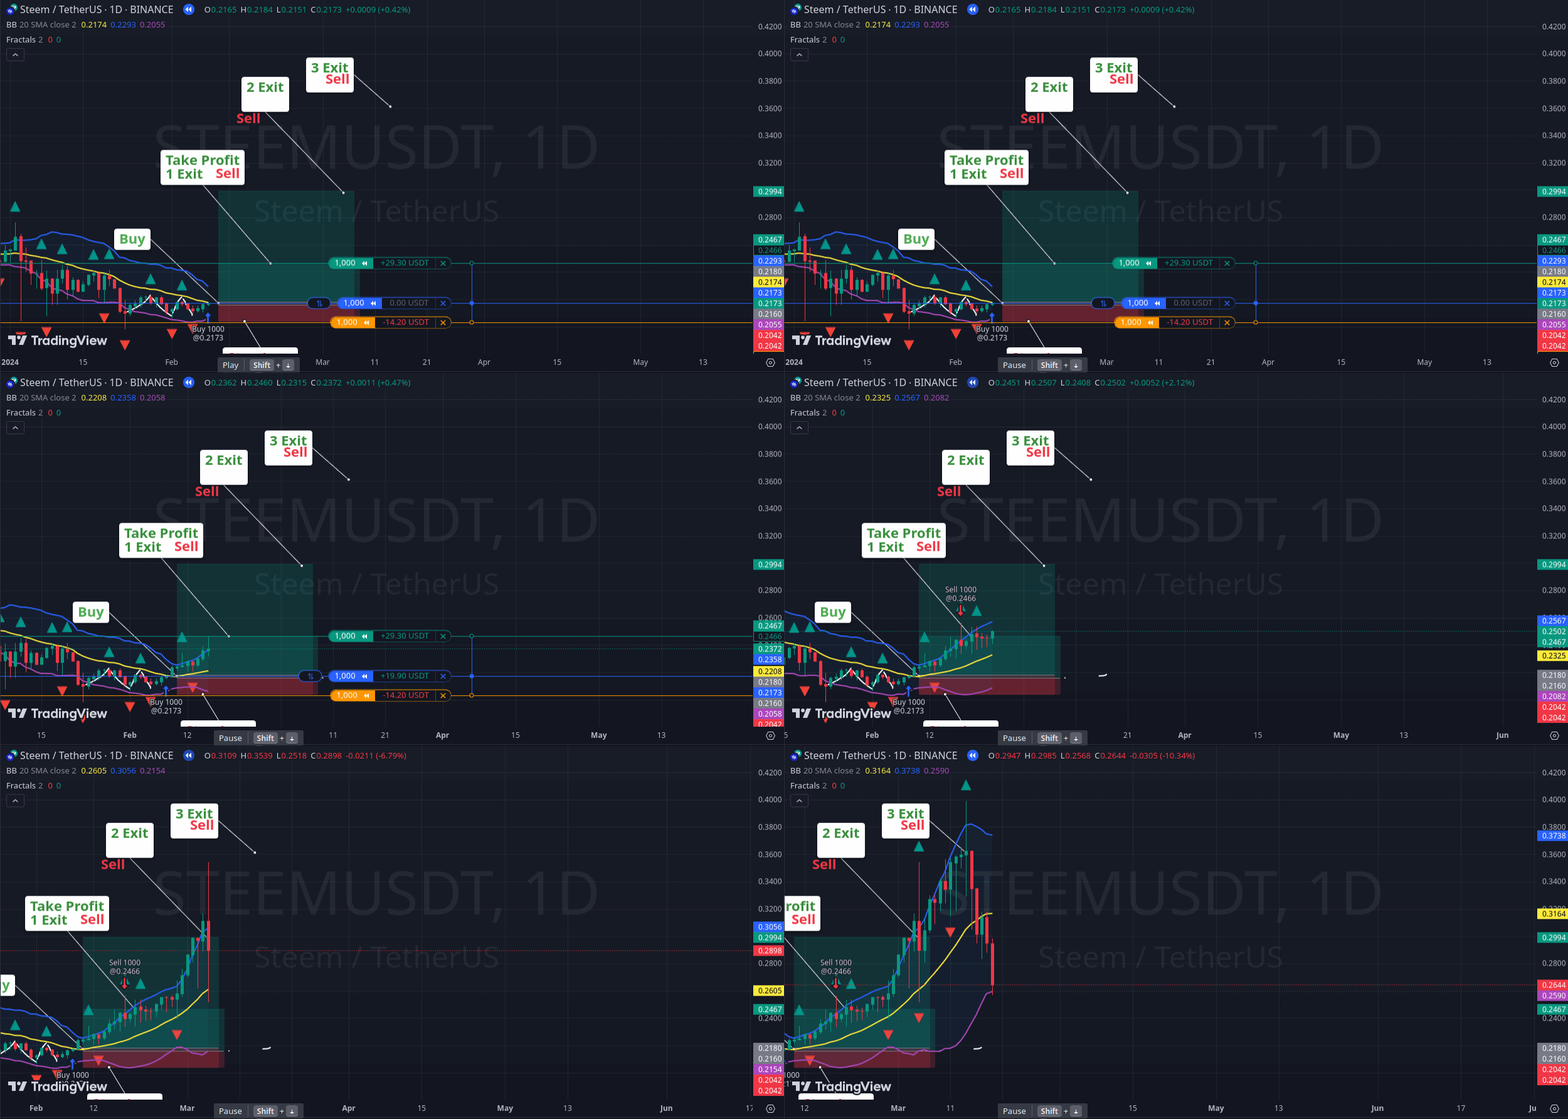
- Тейк профіт (виставляється лімітний ордер, що обміняє STEEM на USDT, в разі росту ціни від точки входу до зазначеного показника): встановлюється на 60-80% від основної висоти фігури, якщо вона велика. В напрямку прогнозованого тренду й супроводжується або не вище висоти основного каналу.
- Стоп лос (виставляється лімітний ордер, що обміняє STEEM на USDT, якщо ціна монети знизиться нижче від ціни покупки): Під нижньою лінією Болінджера з урахуванням мані менеджменту відносно депозиту.
- Вручну: При суттєвих змінах на ринку, якщо ситуація не передбачає досягнення встановленої ціни.
Ще один приклад, коли формується сильний сигнал на зниження, тоді краще продати монети STEEM, якщо були раніше куплені, бо зростання малоймовірне.
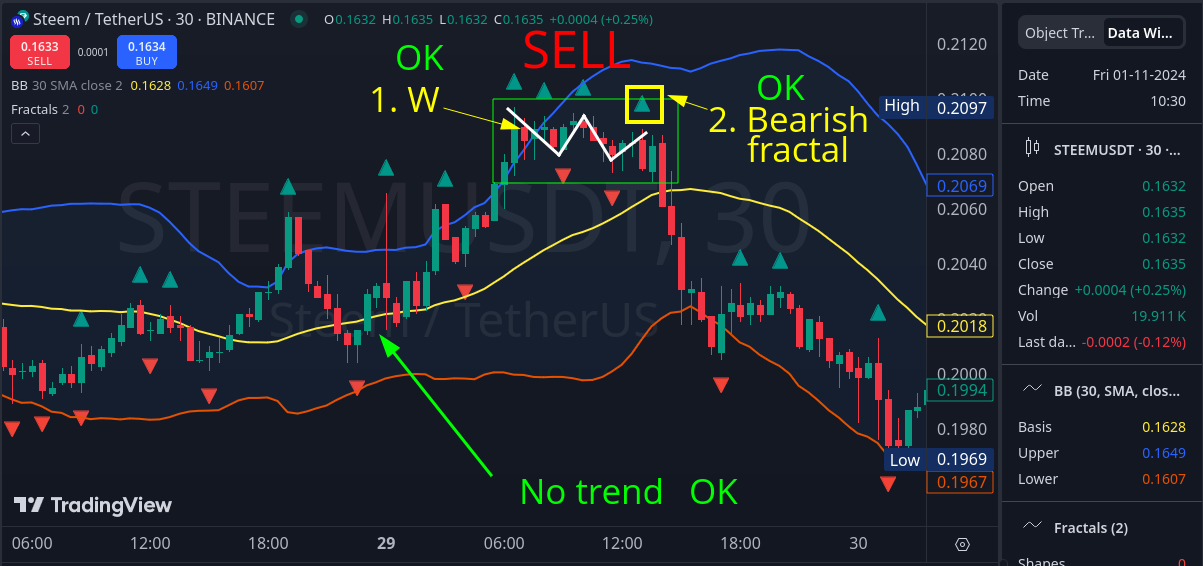
Коментар:
Коли є хороший сигнал рекомендовано купувати, за його відсутності - чекати сприятливих умов.
Аналіз та прогноз STEEM/USDT на основі індикатора Лінії Болінджера
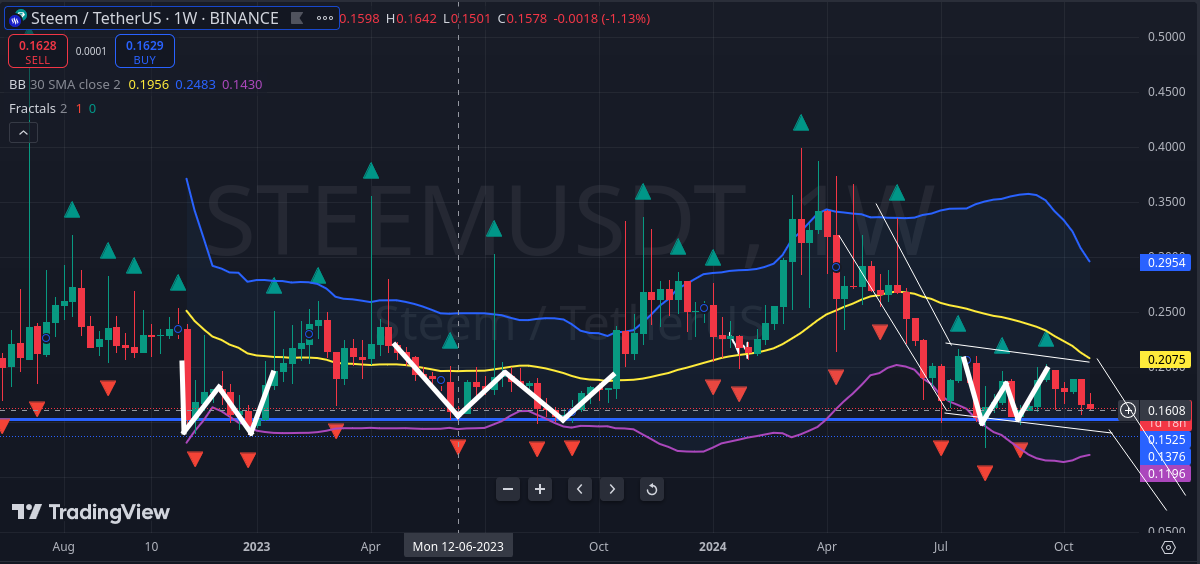
Часовий період W1 має саме підхожий приклад для створення прогнозу, але умови не ідеальні. Адже загалом ціна вже більше двох років глобально перебуває у горизонтальному каналі. Застосувавши індикатор Лінії Болінджера, можна побачити наступну картину.
Глобальний тренд відсутній, адже понад два роки ринок перебуває в боковому каналі. На підтримці 0.1540 вже було два подвійних W дна, що давало бикам трошки піднятись до 0.25-0.40 і при цьому відбувався швидкий перетин середньої лінії Болінджера. Тільки далеко справа не зайшла й останнього разу був підйом вище, а зниження загнало ціну STEEM під середню лінію, де менш впевнено формується W основа, але ціна перебуває під середньою лінією, а бичачий фрактал не утворився, що натякає про невизначеність ринку, адже скоро це може стати M, тобто потрійним дном і ціна може почати фазу зростання, спочатку в рамках каналу до 0.25-0.30, а там буде видніше. Бо є невизначеність, яка має прояснитись в найближчі два тижні, або за результатами виборів у США починаючи із 5 листопада.
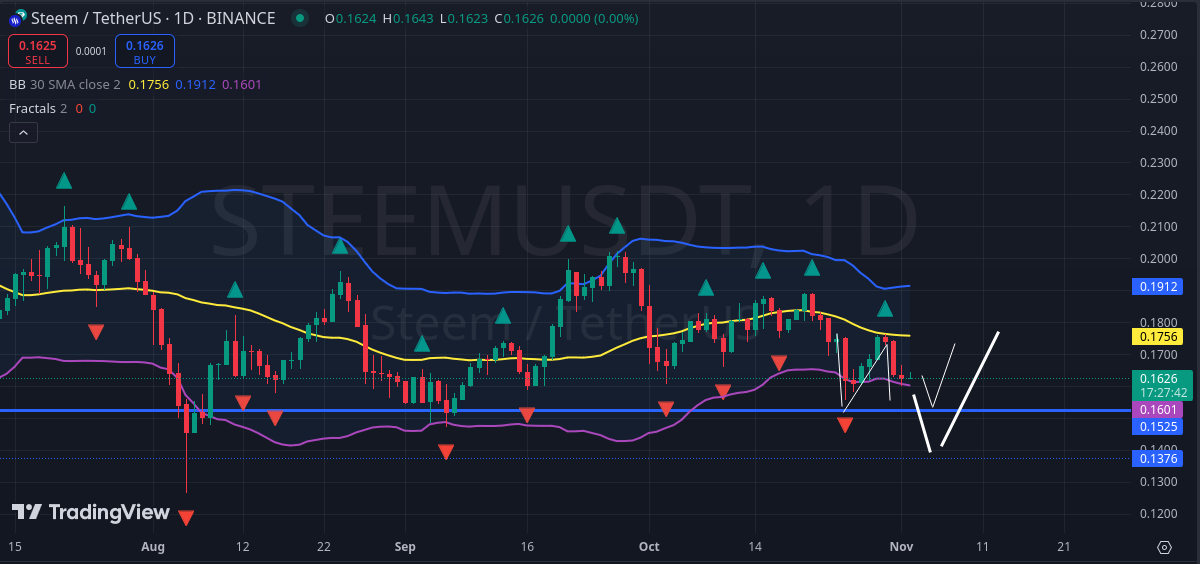
На D1 ціна вже не змогла подолати середню лінію Болінджера, покрутившись довкола неї, а потім зайшла під неї й відштовхнулась від неї як від опору малюючи N патерн, та й бичачого фрактала ще нема, тож це ще не вказує на зростання, бо може бути зниження до 0.1375 із повернення в основний ціновий діапазон. Тож найближчим часом ймовірно продовжиться бокове накопичення із ризиком впасти ще нижче, бо до цього трошки схиляє зміна фрактальної конфігурації.
Використані джерела й ресурси, а також додаткові матеріали для поглибленого вивчення:
- https://www.tradingview.com - окрім задіяних інструментів, також є джерелом знімків екрана;
- Книга "BOLLINGER ON BOLLINGER BANDS" - John Bollinger;
- Книга "M&W WAVE PATTERNS" - Arthur A. Merrill 1980;
- Головне зображення допису згенеровано SDXL 1.0 та відредаговано.

| EN transleted by AI Claude 3 Haiku |
|---|
Bollinger Bands are a simple indicator for quickly determining the market situation and what phase it is in. So it is capable of flat, trend identification and even a hint of its stop or reversal. It is based on Simple Averages (SMA), or rather their three. The standard value of the middle line has a period of 20, and the upper one is the projection of the average shifted +2 upwards. The lower one, accordingly, is -2 down.
Modern indicator solutions can have simpler settings, where there is only one shift indicator, for example 2, which sets the shift immediately for both the upper and lower lines. You can also change the MA time, that is, choose a different time of static data, such as EMA.
This means that the standard period of 20 takes into account almost the entire working month on the D1 time period, as there are weekends on Saturday and Sunday. The cryptocurrency market operates 24/7, so it might be worth considering a period of 30.
The image above shows well that the period of 20 indicates more uncertainty in the market, while 30 is more inclined to a bearish mood, as the price has not overcome the average line.
Variants of market behavior recognition
Uptrend
Price consolidation accumulates mainly between the middle and upper lines. That is, the minimums bounce off the middle, and the maximums find resistance from the upper.

Downtrend
Opposite to the uptrend, the downtrend occupies a position between the lower and middle lines. The minimums find support on the lower line, and the maximums are reflected from the middle.
Range Flat and everything that goes sideways

The price wanders in the channel. Bouncing off the lower line - support, and the upper - resistance.
Trend stop or reversal
When the price range of the uptrend middle-upper line or the downtrend middle-lower line changes by crossing the middle and touching the next one after it. This may indicate a suspension of the directed movement in this direction and a transition to correction or reversal.

Uptrend, then the middle line is crossed from top to bottom with a touch to the lower one. Then lateral movement continues.
Similar to the situation with the uptrend, as mentioned above, only the crossing of the base line from bottom to top.
Narrowing - another interesting sign that a change in the market situation is approaching. When volatility decreases and accumulates, and the Bollinger Bands also become significantly narrower relative to the previous period, then the chances increase that a breakout in one direction or another will soon occur.
Narrowing and bullish movement
Reversal patterns
The indicator itself does not give such strong signals that they would give many chances for success, so another filter is added - technical analysis figures. These are simple formations like M and W, which can be tops or bases on support. It's best when they are formed during a trend stop or reversal, between the upper and lower lines of the Bollinger Bands indicator. Weaker ones will be formed between the middle line and one of the extremes - lower or upper, but it is worth looking at the conditions.
The most common are:
- "Triple Top" W
A strong signal, because it is a large figure between the upper and lower lines. The downtrend was prolonged.
- "Triple Bottom" M

The figure was formed and the price quickly crossed the middle line from bottom to top. There was also a good uptrend.
- "Double Top" M

A huge figure that gave a good bearish trend.
- "Double Bottom" W

A weak double bottom figure on a smaller TF, gave a hint of a bullish move, although it started after a prolonged period of narrowing, but the price did not drop below the base.
This should be enough to start with, because sometimes the simplest things work best. However, this list is not exhaustive, much more is described and classified under the name "M & W Patterns" - Arthur Merrill. So almost everywhere, even if not mentioned, it is used in trading and educational references. And in general, a deeper acquaintance with books and other materials is better for mastering the theoretical part, in order to take into account other details and additional indicators from the Bollinger family and translate this into the practical plane of gaining experience.
Trading strategy for STEEM/USDT spot trading using the Bollinger Bands indicator
Trading pair: STEEM/USDT (and any others).
Difficulty: A little above easy.
Analysis tools:
- Bollinger Bands indicator;
- Technical analysis figures M and W;
- Fractals.
Time period: any, but older is better.
Conditions for buying (exchanging USDT for STEEM and holding in the wallet)
Entry:
- After a downtrend, the price slows down, moving from the Bollinger middle-lower line position to consolidation accumulation, i.e. flat. Forming a reversal figure as a support base in it. Additional confirmation will be provided by the formation of a bullish fractal, which will be much better.
Exit:
- Take Profit (a limit order is placed that will exchange STEEM for USDT, in case the price rises from the entry point to the specified indicator): set at 60-80% of the main height of the figure, if it is large. In the direction of the forecasted trend and accompanied or not higher than the height of the main channel.
- Stop Loss (a limit order is placed that will exchange STEEM for USDT if the coin price drops below the purchase price): Under the lower Bollinger line, taking into account money management relative to the deposit.
- Manually: With significant changes in the market, if the situation does not provide for reaching the set price.
Another example, when a strong signal for a decline is formed, then it is better to sell the STEEM coins, if they were previously bought, because the growth is unlikely.

Comment:
When there is a good signal, it is recommended to buy, in the absence of it - wait for favorable conditions.
Analysis and forecast of STEEM/USDT based on the Bollinger Bands indicator
The W1 time period has the most suitable example for creating a forecast, but the conditions are not ideal. After all, in general, the price has been globally in a horizontal channel for more than two years. Applying the Bollinger Bands indicator, you can see the following picture.
There is no global trend, as the market has been in a lateral channel for more than two years. At the 0.1540 support, there have already been two double W bottoms, which gave the bulls a little rise to 0.25-0.40 and at the same time there was a rapid crossing of the Bollinger middle line. Only it didn't go far to the right and the last time there was a rise above, and the decline drove the STEEM price below the middle line, where a W base is forming less confidently, but the price is below the middle line, and the bullish fractal has not formed, which hints at market uncertainty, because soon this can become an M, that is, a triple bottom and the price can start a growth phase, first within the channel up to 0.25-0.30, and then it will be seen. Because there is uncertainty that should be clarified in the next two weeks, or based on the results of the US elections starting November 5.
On D1, the price was no longer able to overcome the Bollinger middle line, spinning around it, and then went under it and bounced off it as resistance, drawing an N pattern, and there is still no bullish fractal, so this does not yet indicate growth, because there may be a decline to 0.1375 with a return to the main price range. So in the near future, lateral accumulation will probably continue with the risk of falling even lower, because the change in the fractal configuration leans a little towards this.
Used sources and resources, as well as additional materials for in-depth study:
- https://www.tradingview.com - in addition to the used tools, it is also a source of screenshots;
- The book "BOLLINGER ON BOLLINGER BANDS" - John Bollinger;
- The book "M&W WAVE PATTERNS" - Arthur A. Merrill 1980;
- The main image of the post was generated by SDXL 1.0 and edited.
#ukraine #cryptoacademy-s21w1 #club5050 #cryptoacademy #crypto #steem #usdt

Comments