1 TRX = $0.09 USD -- Is it really going down more and more?
3 comments
Charts by TradingView
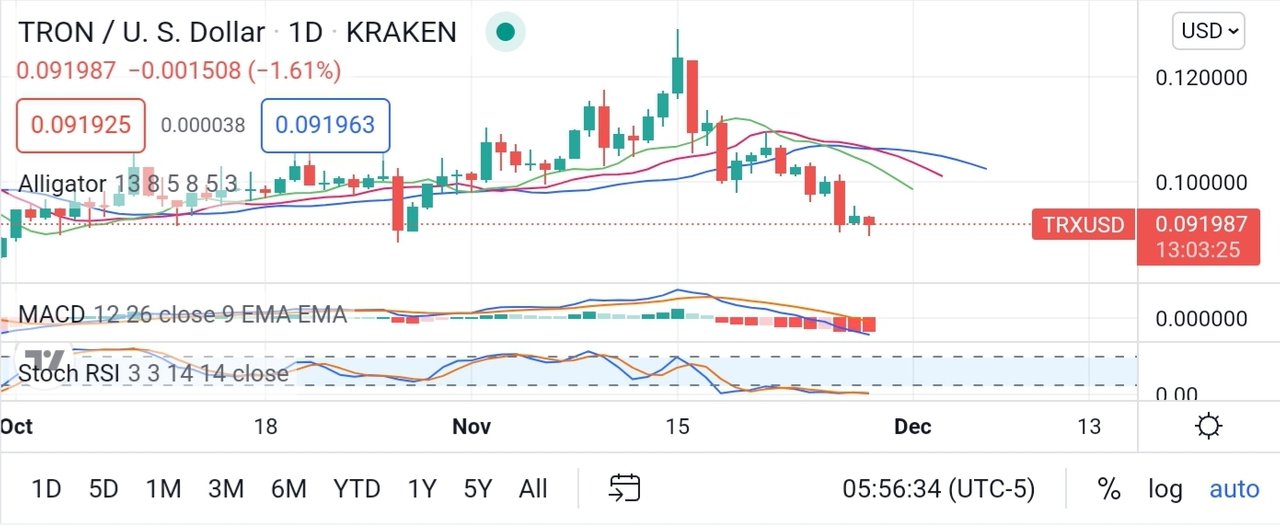
Since early October, the Tron alligator rose slowly through mid-November to over $0.12. After that it experienced a price correction until now.
Then, the MACD (Moving Average Convergence Divergence) oscillator seems to be in a bearish position. This means that the price of this asset is falling.
Meanwhile, the Stochastic RSI (Relative Strength Index) oscillator seems to be in the oversold area. This indicates that the market price of this asset is below its intrinsic price.
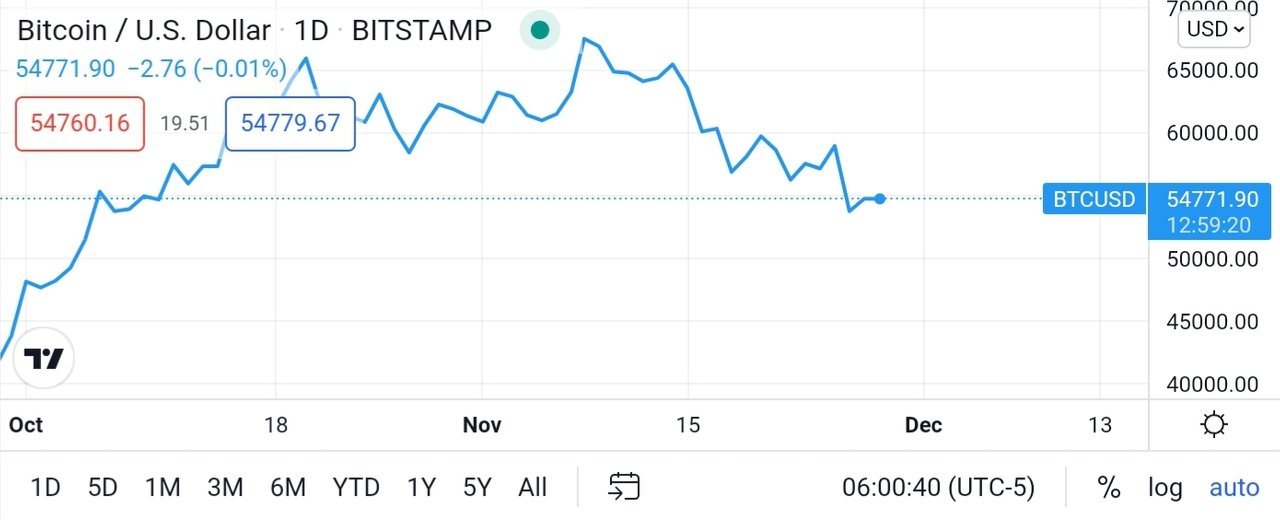
On the other hand, in the chart below, we can see that the price of Bitcoin rose rapidly, but has since been correcting. And usually, bitcoin price fluctuations are followed by other altcoin prices.
At this time, the alligator's mouth looks wide open downwards. Is it really going down and down more and more?
Let's continue following the adventures of this Tron alligator.
See also:
Comments