[Intermediate Course] Steemit Crypto Academy Season 5 Week 4 | Trading With Puria Method Indicative Strategy | How To Make Our Own Strategy
9 comments
Heading - Puria Method Indicative Strategy
Hello steemians how are you? I hope you all are doing well and you all are safe and healthy during this pandemic time.

This is the second Homework task made by me as a professor in the steemitcryptoacademy and this homework is for the intermediate level students.

The Puria Method
The puria method indicative strategy is nothing but simply follow the trend strategy. This strategy become famous in late 2010. This is one of the most efficient, effective, and simple trading strategies used by many traders in their intraday trading. This strategy is used for making small but regular i.e. daily intraday profits in the market.
In the previous lecture, we discuss reversal patterns and create strategies from the candlestick pattern. The Puria method is an indicator strategy that consists of three main indicators i.e. 2 Moving Averages and Moving average convergence divergence(MACD).
The moving average work as Resistance and support the price chart while the MACD is used as a filter that indicates perfect entry and exit point in the market.
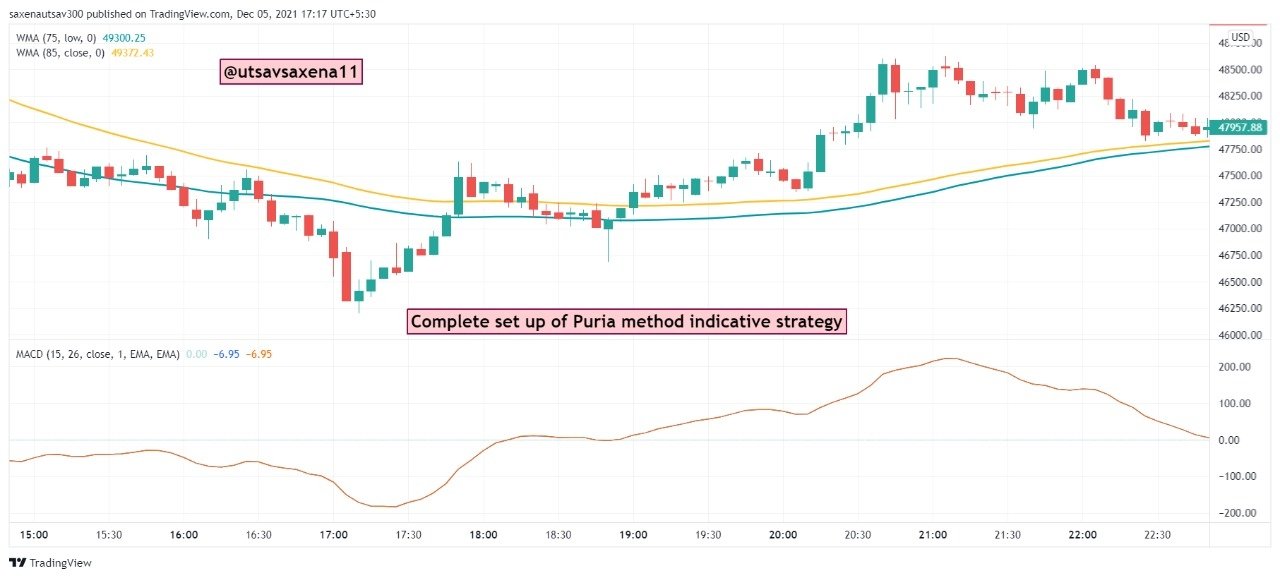
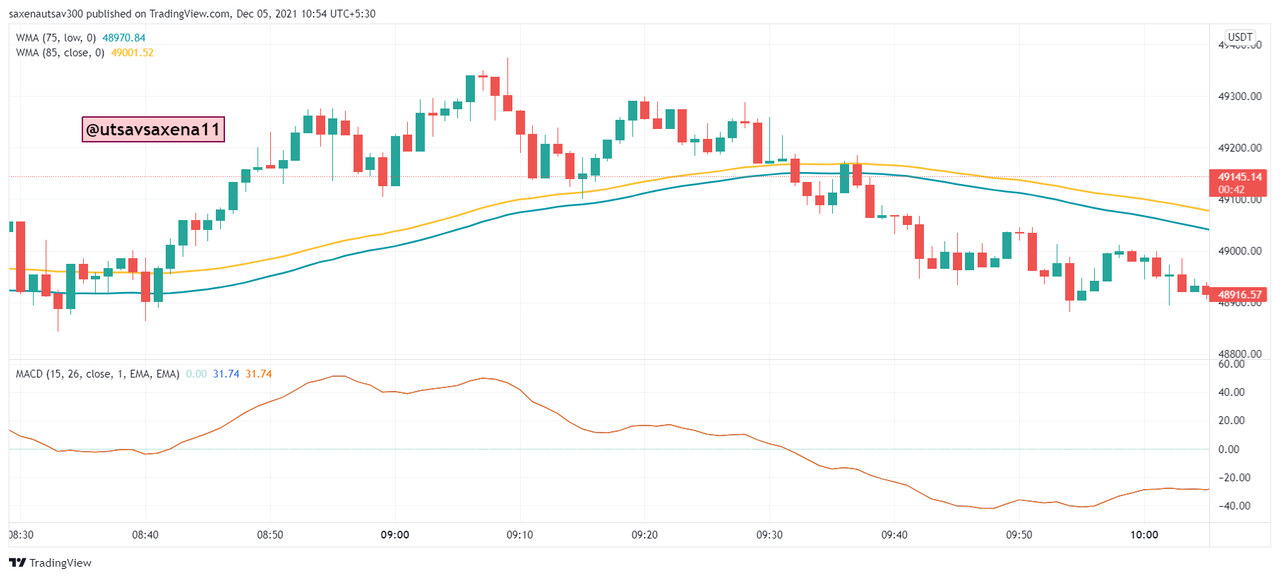
In the above BTCUSD pair, we can see that there are two Moving Averages and a Single MACD indicator. This is the setup of the Puria strategy. But what are the specifications we require in this strategy we will discuss them later in the article. This strategy exist for a very long period of time. Let us now discuss its working, role of MACD and moving averages, Entry and exit from the market, best time frame, and pros & cons.
The Puria Method Indicators input
While working on any such indicator-based strategy we have to check the requirements and settings of each indicator we apply on the chart. Here we are using two Moving averages and one MACD. So let us first discuss the settings which we require in the puria method. You have already learned how to apply the indicators on the chart in the trading view. Let's not go into that and simply understand the Settings of each indicator.
MOVING AVERAGE WEIGHTED(WMA):
Since we have to use the weighted method, so simply search Moving Average Weighted in the trading view and apply two WMA on chart patterns.
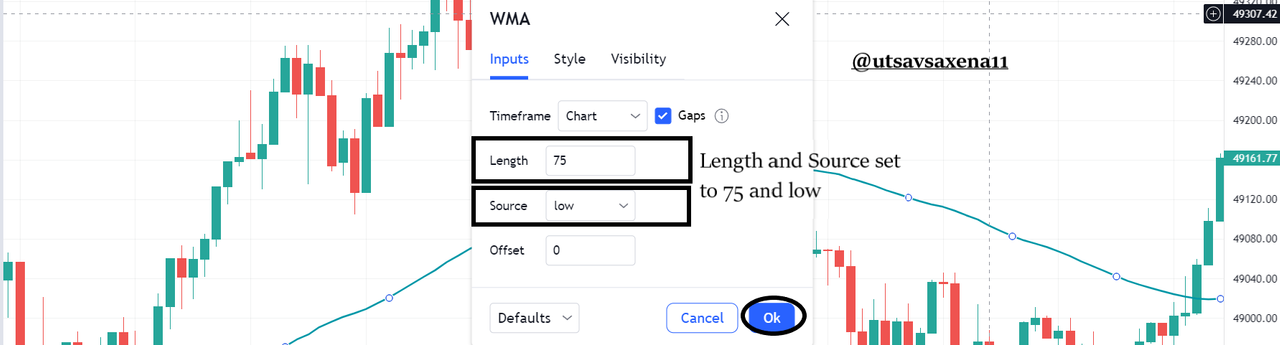
The first WMA is set up on a 75 period length with the source LOW. The time we choose for the indicator is the same as that of the timeframe. Style, choose any color except (RED AND GREEN). Let us take a look at all these settings in the provided screenshot below.
The Second WMA is set up on an 85-period length with the source CLOSED. The time we choose for the indicator is the same as that of the timeframe. Style, choose any color except (RED AND GREEN). Let us take a look at all these settings in the provided screenshot below.
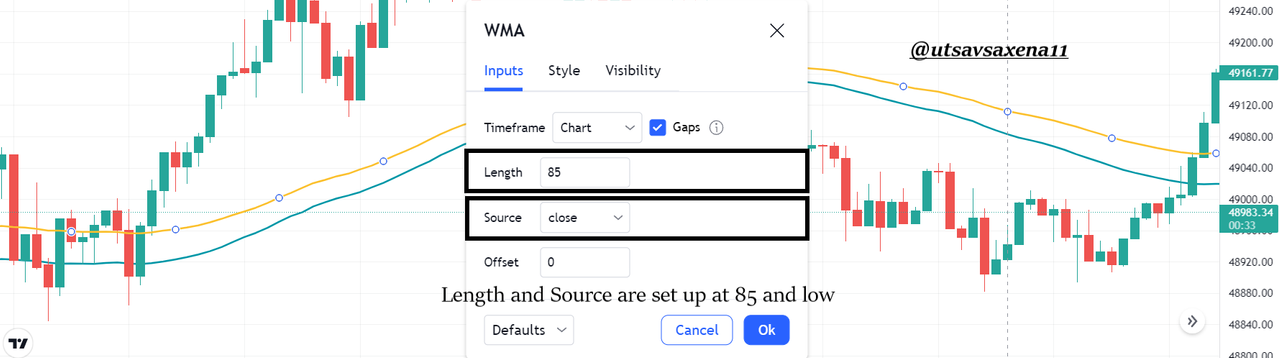
The above two screenshots show that we have to set up WMA on 75 and 85-period lengths one as low source and another one as closed source.
MOVING AVERAGE CONVERGENCE DIVERGENCE(MACD):
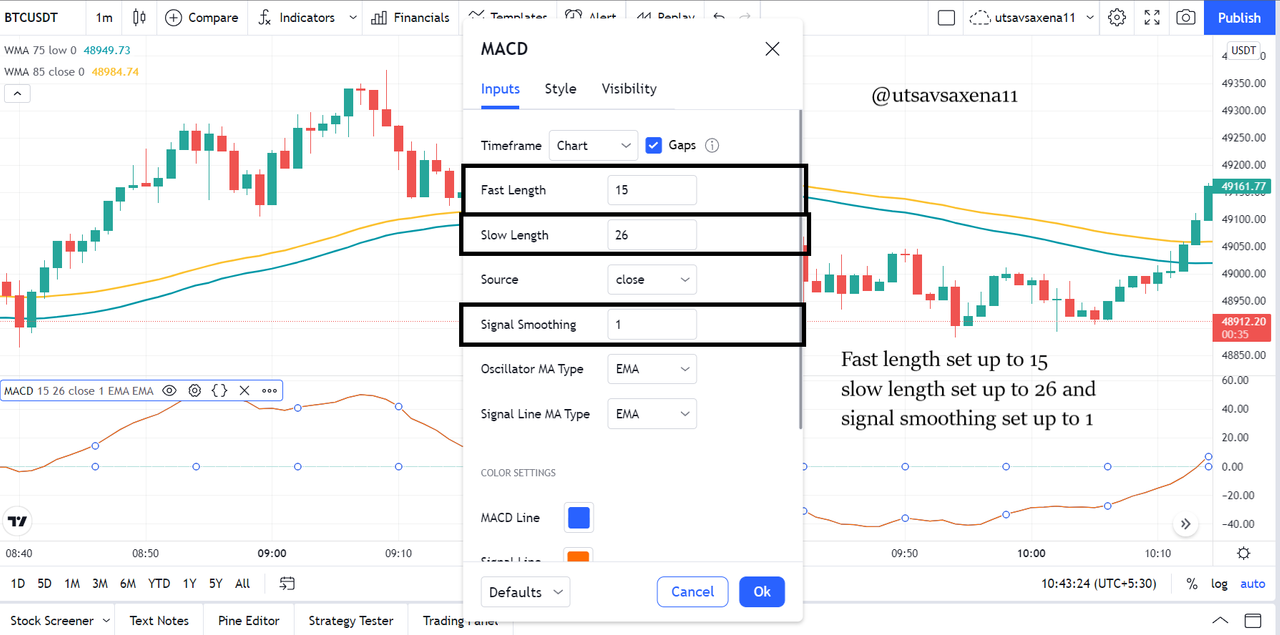
In MACD we have to change 3 settings. First, change Fast length from by-default to 15. Second, change the slow length to 26 and finally change signal smoothing to 1 from 9. We can observe that by changing signal smoothing, our candles on the MACD chart vanish out and we can only see the zero line now. Choose any colour from styles for the average moving line of MACD.
Our puria method setup is now complete. Let us take a complete look at the trading setup which we developed.
Now let us discuss entry and exit points in the market by using the puria method. It is very easy to analyze the entry and exit point in the market by this method.
The Puria Method Entry and Exit points
As we discussed earlier also that the key principle of the Puria Method is to follow the trend. 2 Moving Averages will help you determine the direction of the trend while MACD (the Moving Average Convergence-Divergence) will help us spot the wave of an up- or downtrend.
Before making an entry and exit from the market we have to decide the perfect timeframe. Choose a timeframe between 5 mins to 300 mins. Now it's time to make an entry into the market.
ENTRY/BUYING SIGNAL:
To make an entry into the market first we have to check the MACD line. When MACD line crosses the zero line and start moving upward then it is considered as a starting signal of the uptrend. Then wait for the candles to move above the moving averages. Once it moves above the moving average than simply take the trade that is buying the asset. You can choose any risk: reward ratio. I will go for a 1:1 risk-reward ratio. Risk management while trading is important, so don't forget to apply to stop loss and take profit.
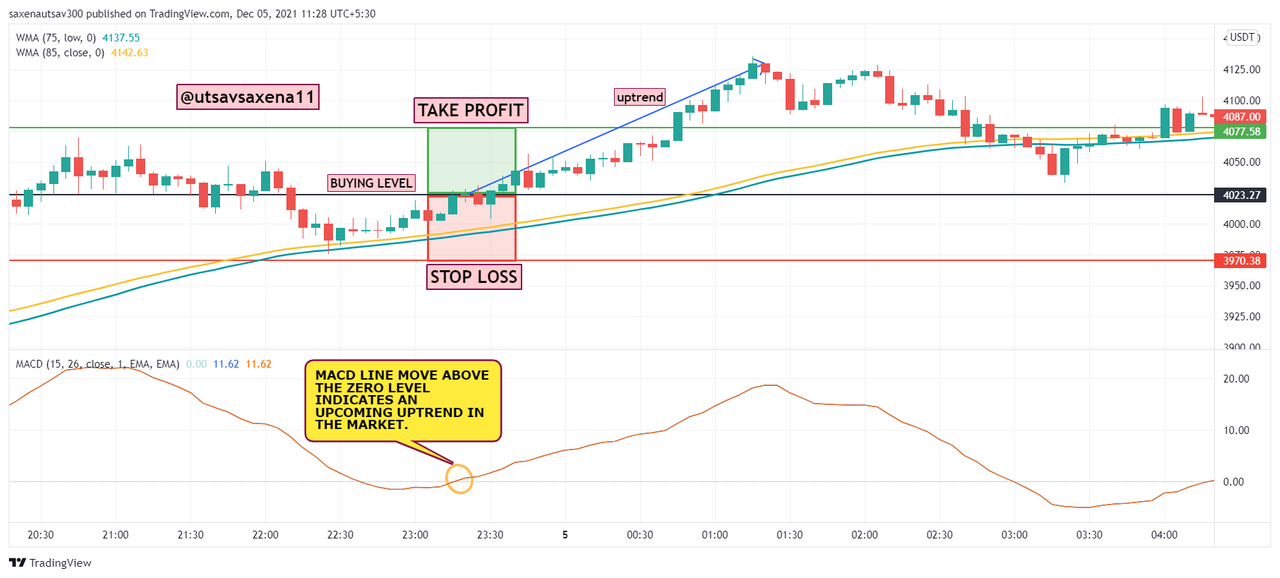
In the above ETHUSD chart of 5 mins timeframe, you can see that the MACD line first crosses the zero level. Once it crosses the zero level then we wait for the candles to break the Moving average and move above. After 2 candles we buy trade and secure our trade by applying take profit and stop loss. As we can clearly see the market is moving in an uptrend direction.
EXIT/SELLING SIGNAL:
To make an exit from the market first we have to check the MACD line. When the MACD line crosses the zero line and starts moving down then it is considered as a starting signal of the downtrend. Then wait for the candles to move below the moving averages. Once it moves below the moving average then simply take the trade that is selling the asset. You can choose any risk: reward ratio. I will go for a 1:1 risk-reward ratio. Risk management while trading is important, so don't forget to apply to stop loss and take profit.
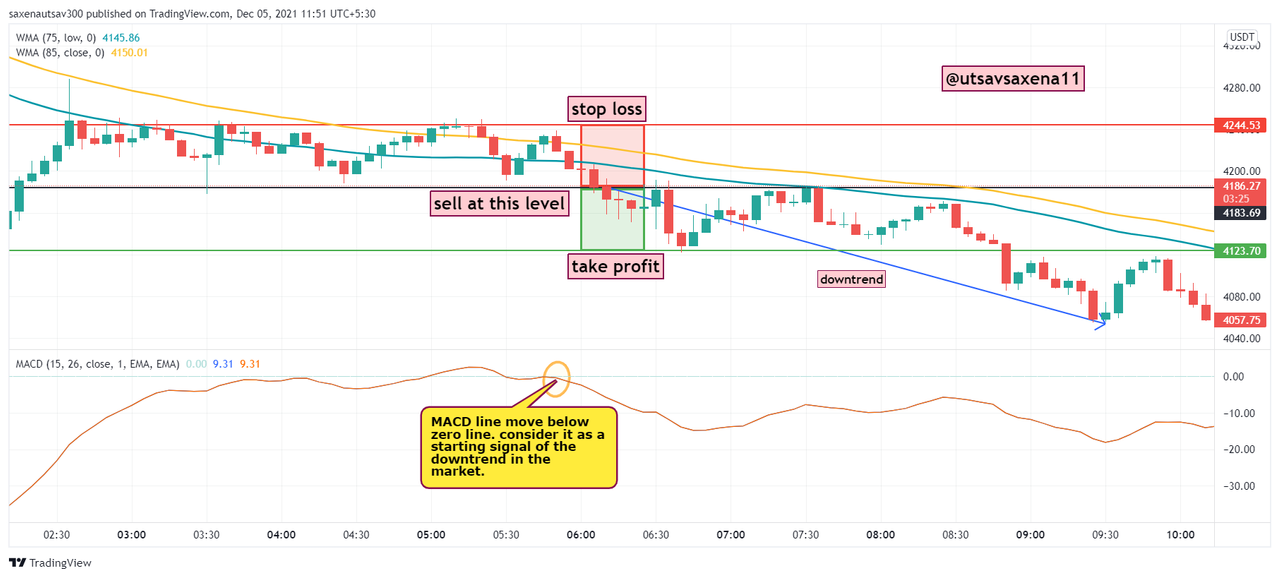
In the above ETHUSD chart of 5 mins timeframe, you can see that the MACD line first crosses the zero level and move below. Once it crosses the zero level then we wait for the candles to break the Moving average and move below. After 2 candles we sell trade and secure our trade by applying take profit and stop loss. As we can clearly see the market is moving in a downtrend direction.
This is how by using the puria method we can make entry and exit from the market. Also, we can clearly decide the trend in the market by using is strategy.
How to create our own trading strategy:
Many traders start using different trading strategies and different indicators that are pre-developed. But this time we will try to develop our own trading strategy in the market. This strategy can be based on patterns or on indicators. While making our strategies the only thing we have to keep in our mind is that we have to follow a few steps to get good, efficient, and a strategy that provides us good results in the market.
The steps we have to follow are :
Prepare your market ideology:
First, develop a complete analysis of the market in which you jump. Lack of information may impact your portfolio. Market ideology needs technical and fundamental analysis, demand and supply understanding.Choose the market :
Since we are working on cryptocurrency, so we have to create a strategy for or several crypto pairs. But your strategy not only works on cryptocurrency but also works on other markets like forex, equities, and so on.Choose trading time frame:
Time frame plays a major role while trading. Every strategy is developed on a particular time frame, so it is important to decide whether you work on a short time frame for a long time frame with your developed strategy.Predefined entry and exit:
Once you create the strategy you have to predefine the entry and the exit point from the market. Once you do so, it will become easy for you to secure yourself from fakeouts and traps.Risk management:
While creating a strategy it is important to manage your risk, predefine your stop loss, and take profit levels.Use the indicator to filter false signals:
Sometimes strategies also provide for signals, so to filter such signals we require to add indicators to filter out false signals from the market.
These are the basic steps we have to follow while creating our own strategy in the market. We can create any one of the strategies like pattern strategy or indicator base strategy. Only we have to follow these steps to get profitable trade and green portfolio.
Advantages and Disadvantages of the Puria Method
Every strategy and indicator has its own advantages and disadvantages. One side advantages help us to make our portfolio green and on the other side disadvantages of certain strategies make our portfolio red. So while managing risk it is also important to understand the disadvantages and advantages of each and every strategy and Indicator we are using.
Advantages:
Puria Method provides an easy and efficient spot of entry and exit for intraday traders.
We can easily set up this strategy in any market by changing the lengths of WMA and MACD indicators.
We can use a time frame starting from 5 mins to 1 hour. This will help traders to analyze prices and candles at many different levels.
Disadvantages:
While working on this strategy sometimes a trader falls into fake-outs and traps. We have to avoid those traps. Sometimes prices hover near WMA lines because of which restless traders buy or sell trade and are stuck in false traps.
Consider disadvantage as a precaution while using this strategy in the market.
Conclusion:
Now it is time to conclude our homework post in which we discuss the puria method indicator strategy. This is strategy consists of three main indicators 2 moving averages and MACD. The basic principle of this indicator is to follow the trend. When we follow the trend correctly, we can easily take entry and exit from the market. Always try to use a time frame between 5 minutes to 1 hour how to get better results in the market.
In the second part, we discuss how to create our own strategy using indicators and patterns in the market. If we follow the rules and regulations and control our emotions in the market we can make better strategies and can gain huge profits.
With these final words I am submitting my homework post, given below are the assignment questions follow the guidelines, and complete the task.
Homework
Before you start the homework task try to read this article at least twice. It is a practical based assignment, Try to do proper research and give answers to the following questions :
1. Explain Puria method indicative strategy, what are its main settings. which timeframe is best to setup this trade and why? (Screenshot needed and try to explain in detail)
2. How to identify trends in the market using the puria method. Is it possible to identify trend reversal in the market by using this strategy? Give examples to support your article and explain them. (screenshot needed)
3. In the puria strategy, we are using MACD as a signal filter, By confirming signals from it we enter the market. Can we use a signal filter other than MACD in the market for this strategy? Choose one filter(any Indicator having 0 levels) and Identify the trades in the market. (Screenshot needed).
4. Set up 10 demo Trades (5 buying and 5 selling ) on 5 cryptocurrency pairs using puria method indicative strategy. Explain any 2 of them in detail. Prepare a final observation table having all your P/L records in these 5 trades.
Components of the table:
| S.no. | Pair | Buying Price | selling Price | profit | loss | time frame |
|---|
5. You have to make a strategy of your own, it could be pattern-based or indicator-based. Please note that the strategy you make must use the above information. Explain full strategy including a time frame, settings, entry exit levels, risk managment and place two demo trades, one for buying and the other for selling.
Homework Rules and Guidelines
Read all the given guidelines and instructions carefully.
Homework assignments must be posted in the community Steemit Crypto Academy.
THERE WILL BE NO APOLOGY FOR PLAGIARISM IN STEEMITCRYPTOACADEMY.
According to the latest rules, only people who are actively participating in the #club5050 are eligible to take part in Crypto Academy homework assignments. check your eligibility before uploading the homework post. #club5050 status (last one month) is a prerequisite to participating in this homework task. The minimum threshold for Club5050 is 150 SP power up in the last one month regardless of the payout and earning. This is applicable for both active and inactive users. The upper threshold is subject to your cashout and earning for the specified period(i.e. last one month).
Post title must be written in the format "Puria Method Indicative Strategy- Steemit Crypto Academy- S5W4-Homework post for @utsavsaxena11. "
The minimum reputation to take this class is 60.
The minimum Steem Power that must be owned is 600 SP. (Not including delegated)
Accounts that are powering down are not allowed to take this class.
The minimum number of words in the post is 500 words.
Use images that are Copyright-free and list the source of these images.
All screenshots taken must be given a watermark that includes your username.
Put the tag #utsav-s5week4, and #cryptoacademy in the first 5 tags of the post.
User must include their respective country tags in the homework assignments.
Do proofreading before uploading your homework post and check tags 2-3 times.
Put the task link in the comments column if it has not been rated for 2 days or more.
Justifying the text is necessary and the users from India are requested to add #India as one of the tags.
All these guidelines will effect your marks in presentation and originality. So read it carefully.
If you have any doubt in the assignment given, feel free to ask it in the comment section below.
Homework assignments deadline is until December 11th 2021 at 23:59 UTC.
CC:
@steemitblog
@steemcurator01
@steemcurator02

Comments