In order to understand the confirmation of Volume Signals, we will also have to look at the nearest Support and Resistance Zone. When Price breakout to the Resistance level and Volume is also high so it is a confirmation of the Bullish trend. But, the second confirmation for the entry point is when the next candle and volume are sustained above the breakout level.
Similarly, when breakout to the Support Level and Volume is high then we can conclude that now trend will change and next moves will be at the downside, but again the second confirmation for the sell entry point is when the next candle and volume are sustained below the breakout level.
Let's understand the Volume signal confirmation on Chart.
 Volume Confirmation Chart.
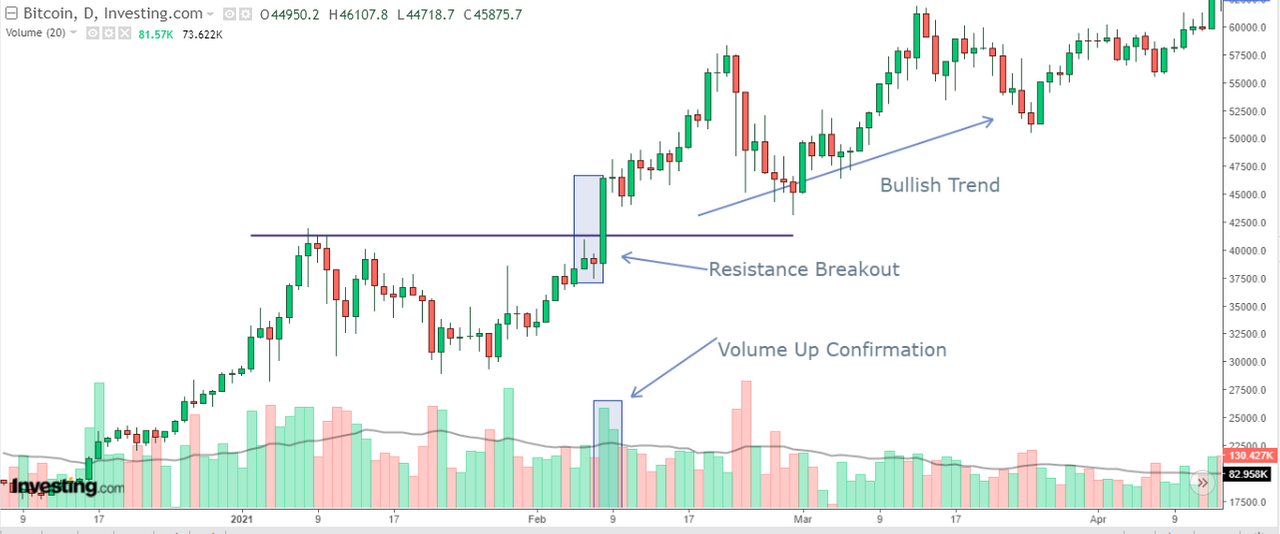
From the left, we can see the price down from a particular level hence it could be a resistance level so we have drawn a line to understand the resistance zone. Then we can see the huge volume appeared and similarly the price break the resistance level. Here, we can also see the volume is gone above 50 Moving Average.
The candle is sustained above the resistance level, also the next volume is still high, this is the confirmation of starting point of the bullish trend. Buyers can take their entry when the candle is sustained above the resistance level. Further, we can see after confirmation the price went up which is Bullish Trend.
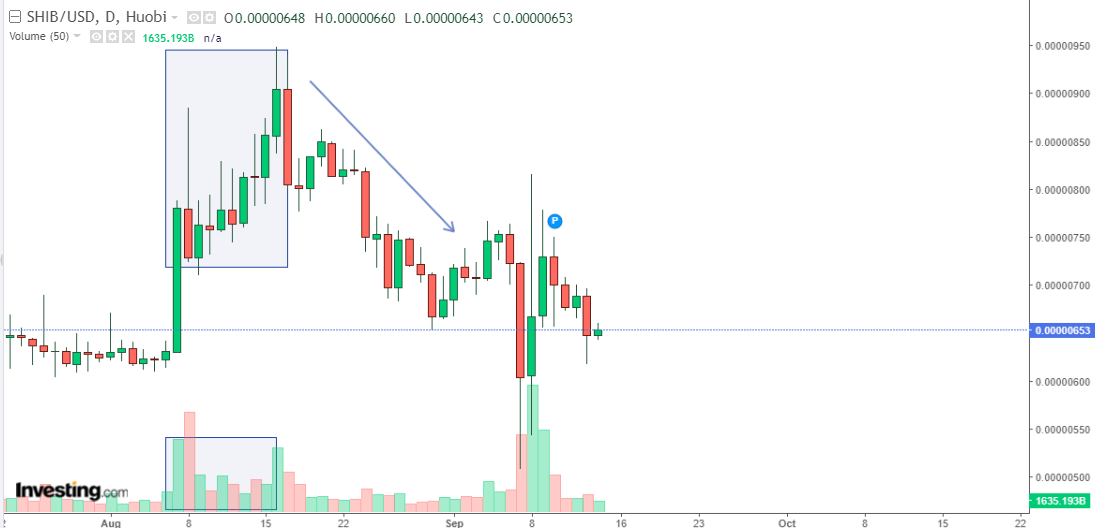
Example 2
 Volume Confirmation Chart.
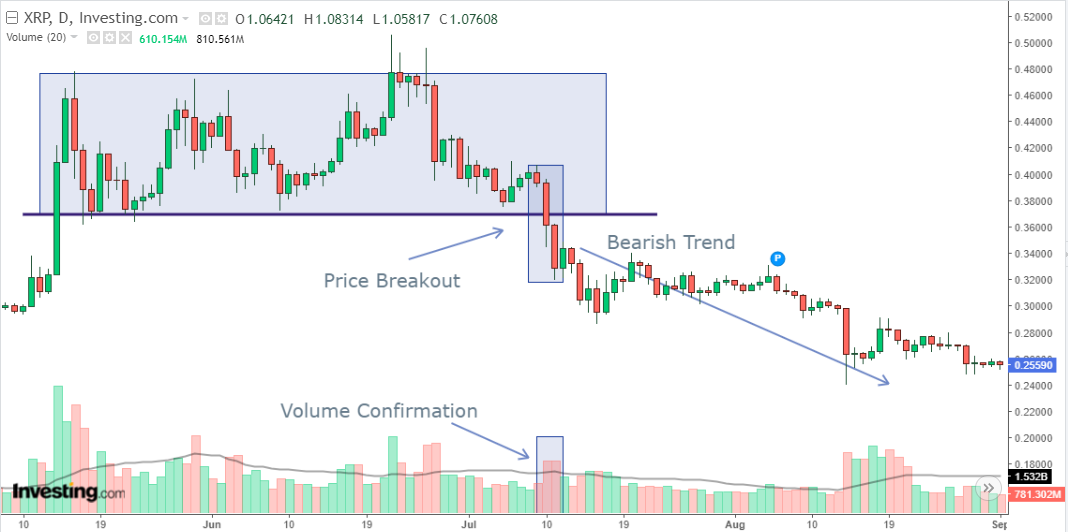
From the left, I have drawn a box to understand the price level and Support level drawn dark. Further, we can see there is a breakout given at the support level, at a similar time the volume is also high. Also, the Volume is gone above 50 days Moving Average.
The candle is sustained below the support level, also the next volume is still high, this is the confirmation of starting point of the Bearish trend. Sellers can take their entry when the candle is sustained below the support level. Further, we can see after confirmation the price went down which is Bearish Trend.

How does the volume reflect the evolution of prices in the charts and why does the volume sometimes anticipate the price?
In order to understand how the Volume shows the growth in price, we need to check the Volume candle compare to the previous Volume candles. Here, we can consider previous candles around 10, If the Volume candle is higher than the previous 10 volume candles, then we can see the growth in price.
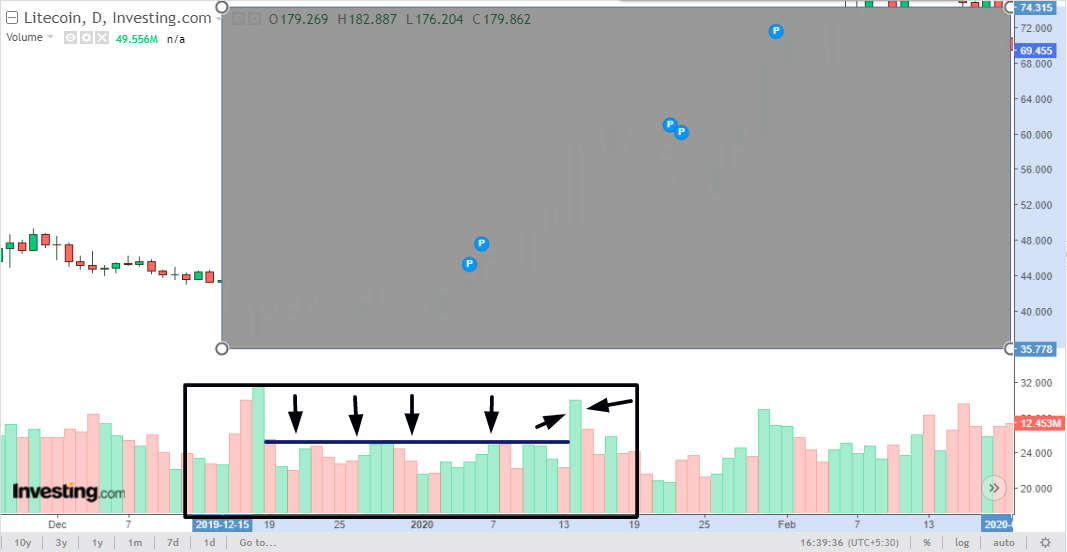
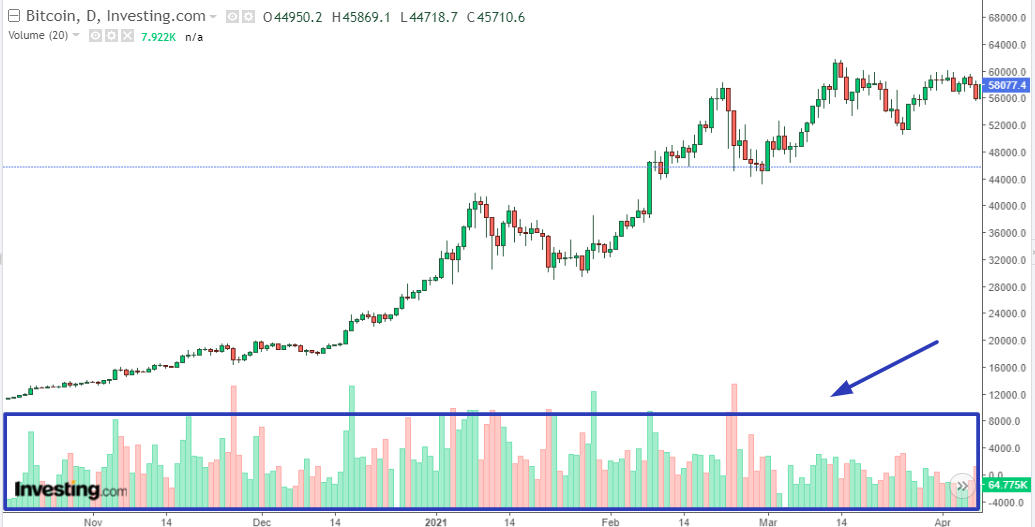
To understand correctly how Volume shows growth in price I have to hide the main chart and we will focus on the volume Chart. Please look into the below picture.
 Volume Reflect The Evolution Of Prices.
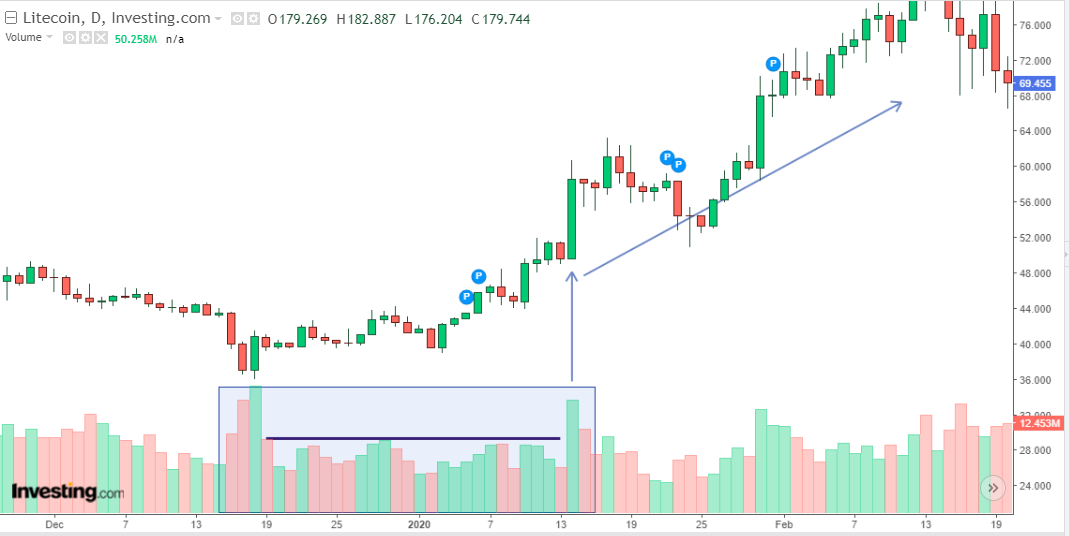
As we see on the right side the huge volume appeared on a Volume chart and is it bigger than the previous few candles, here the big volume compare to the previous volumes can be a sign of the further growth in price and this is how volume reflect the evolution of prices in the charts. Now let's see its result with the main chart which was hidden in the above image.
 Volume Reflect The Evolution Of Prices.
The Volume sometimes anticipates the price this is the behavior of a market that sometimes the bigger Volume appears on the Volume chart but the price does not show that much growth on the chart due to which volume sometimes expects the price. This behavior can be possible when the market wants to trap people or the market does not want to show its next trend even we can see the volume is already generated for that which means operator and investor are already entered but price growth is almost neutral as compared to the volume. Please check the below chart example for this.
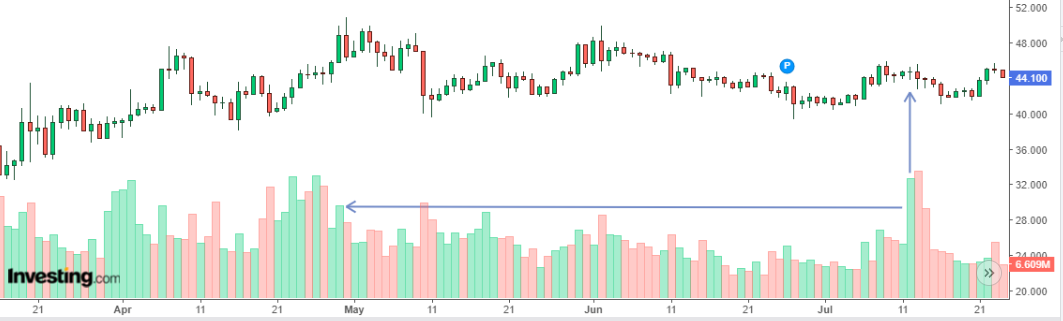 Volume anticipate the Prices.
So here, we can clearly see that the huge volume appeared on a Volume chart and it is bigger as compared with the previous Volumes, but still, if we look at the price so there is not much movement even huge volume is there. We can say it's a false signal. Here, the price almost remains at the same level of few previous trading sessions. In such a situation the volume expects prices.
Is it better to use the volume indicator alone or use it in parallel with another indicator when trading?
While treading it is always not recommended to fully depend only on one Indicator as to confirm entry and exit point we should also consider at least 2, 3 indicators. Even if we talk about Volume, so we seen above in the configuration part, there is a Moving Average option is given which we can apply on a volume chart, that is the reason we should use a Volume Indicator parallel with another indicator when trading.
Technical indicators like Volume are provided to understand the price movement in the market so that accordingly we can think what trade we have to take, but indicators accuracy is not always 100% correct. Hence, to make a concrete decision about the trade we have to take different signals that are shown by other indicators.
When we see 2,3 indicators are giving Buy signals then we can think for buy, similarly for sell. but if 1 indicators shows buy but at the same time other indicator shows sell, then it is confusing, so here either we should wait till the majority of indicators show one direction or based on 1 indicator signal you can trade as per your skill level with proper stop-loss.
Still, it is not recommended to take a trade on one indicator decision. To justify this information, let's understand this on Chart.
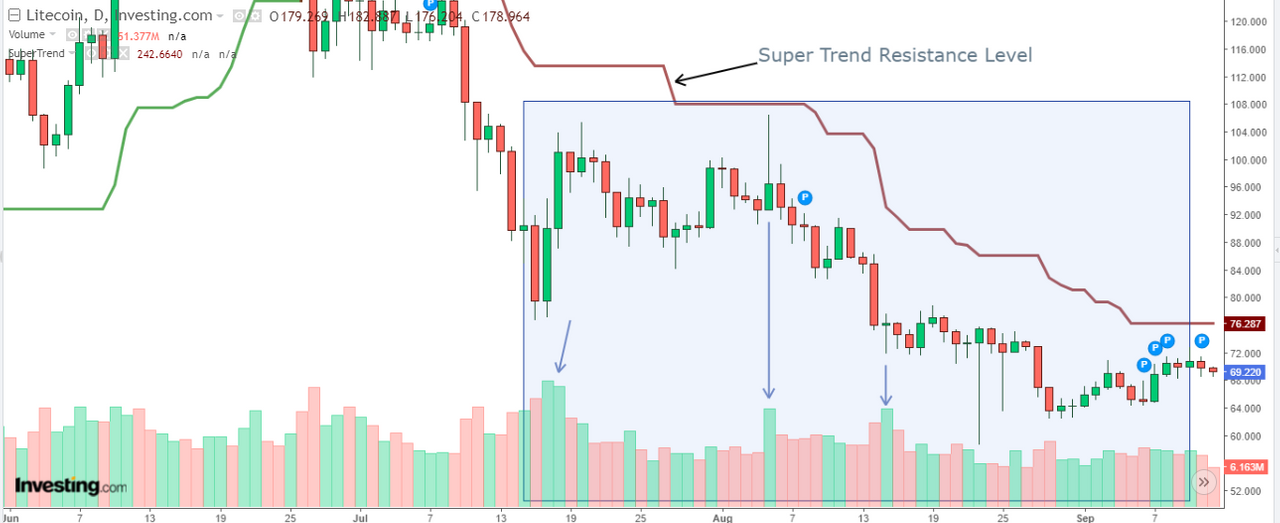 Chart with Volume and SuperTrend Indicator.
In the above image, we can see a Volume indicator with a SuperTrend indicator. If we look at the volume side so we can see multiple times Volume chart has shown the growth of price but does the price really go up, NO, Why?
There are multiples points on the chart where different sellers and buyers are placed which we will not be aware of without technical indicators. Every Technical indicator has different definitions and Support-Resistance levels.
the support level shown by one indicator is might be the resistance level for another indicator, so here we may got trapped when depending only on one indicator.
In the above image, I have shown the SuperTrend Resistance Level by the arrow. The volume chart shows a huge volume but at the same level, there are sellers available as per the SuperTrend Resistance Level which is pulling the price down. So, here we will get a chance to think twice about where we should go with Volume only or wait to see when both indicate buy. Let's see another example below.
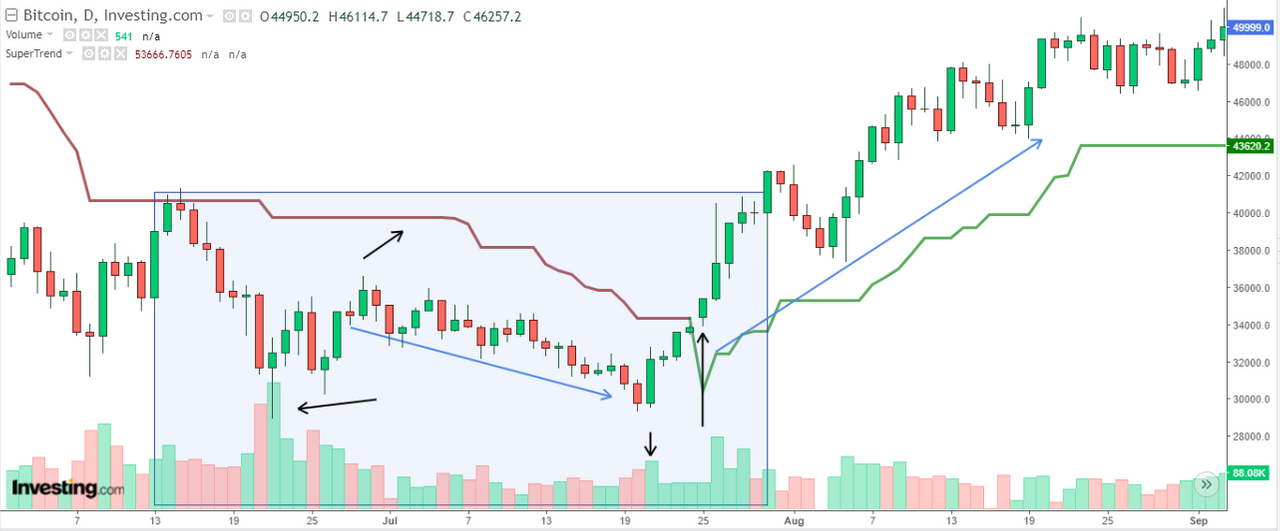 Chart with Volume and SuperTrend Indicator.
Read the chart from Left to Right shown in the box. Starting we see volume is present but the price is going down and this is because there is a resistance level by SuperTrend. Then on the right side, we see Volume is high and Supretrend Resistance level is also broken which is a buy signal from SuperTrend. So, here two indicators show the Buy side which is a strong signal for Bullish, further we can see the price goes up.
Hence, not only volume indicator but it is not recommended to fully trust only one indicators signals, always use at least 2 or 3 Technical indicators for confirmation of signals.
Price Volume Trend Indicator Meaning, Strategy, Chart Study.
Meaning.
Price Volume Trend(PVT) is one of type of Volume Indicator which use to identify the asset's demand, Supply and also help to find market direction upside or downside.
Price Volume Trend(PVT) is the easiest indicator I will say because by applying it on the chart it will get easy to understand the future market price action whether it will be going upside and downside.
Based on asset upward or downward direction the volume line performs a percentage change by addition or minus in an asset trend and current volume.
Strategy.
Below are the Strategies for Price Volume Trend(PVT)
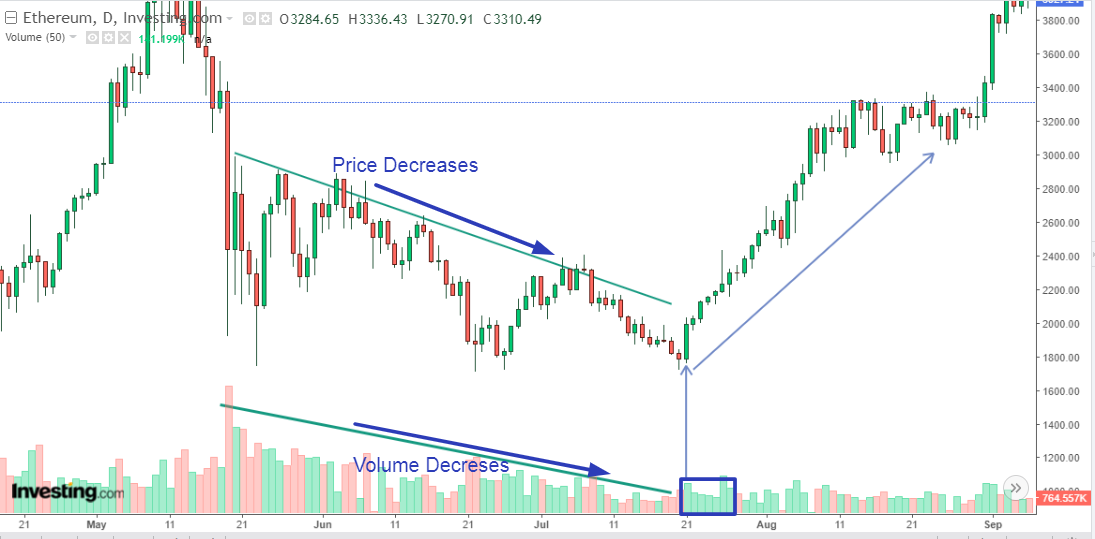
Price and volume increased then it confirms that the price will be Up Trend.
Price and volume decrease then it confirms that the price will be Down Trend.
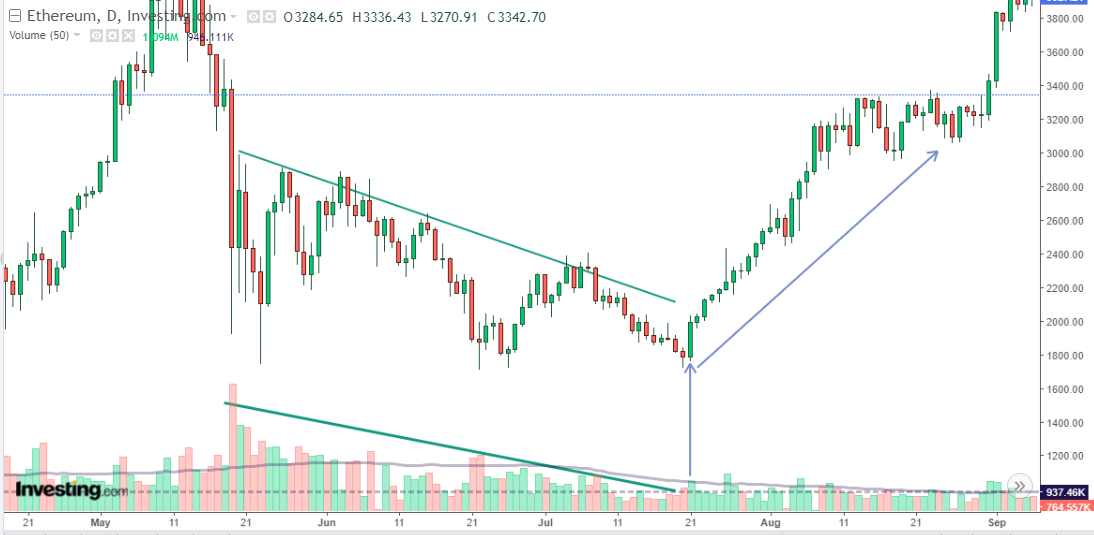
Price increases but volume is decreasing or flat is a negative sign and indication that the downside price direction is going to weak and possible reversal trend.
Price decreases but volume is increasing or flat is a positive sign and indication that the upside price direction is going to weak and possible reversal trend.
Chart Study.
The Chart analysis of Price Volume Trend(PVT) is very simple, as mentioned in the Meaning above, we don't actually need to do additional or minus, its already done by the indicator and we just have to look at the Price Volume Trend and Price Trend. Here we will also add the Price line in Price Volume Trend so that it will get easier to understand the reversal patterns, please see the below image.
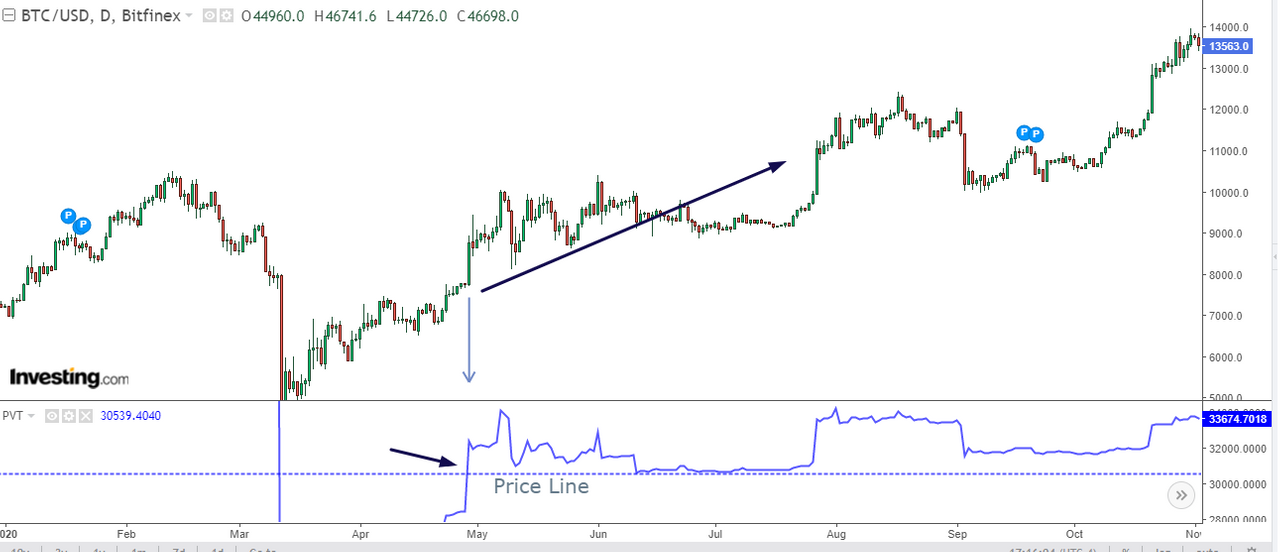 Chart with Price Volume Trend(PVT) Indicator.
As I mentioned the Price Volume Trend(PVT) Indicator is easy to read and predict the market trend. Here we can see from the left, the price started moving above, and then the Price Volume Trend (PVT) Indicator has crossed the price line upside which is an indication of a bull trend, accordingly, we can see the price growth, a trend becomes bullish.
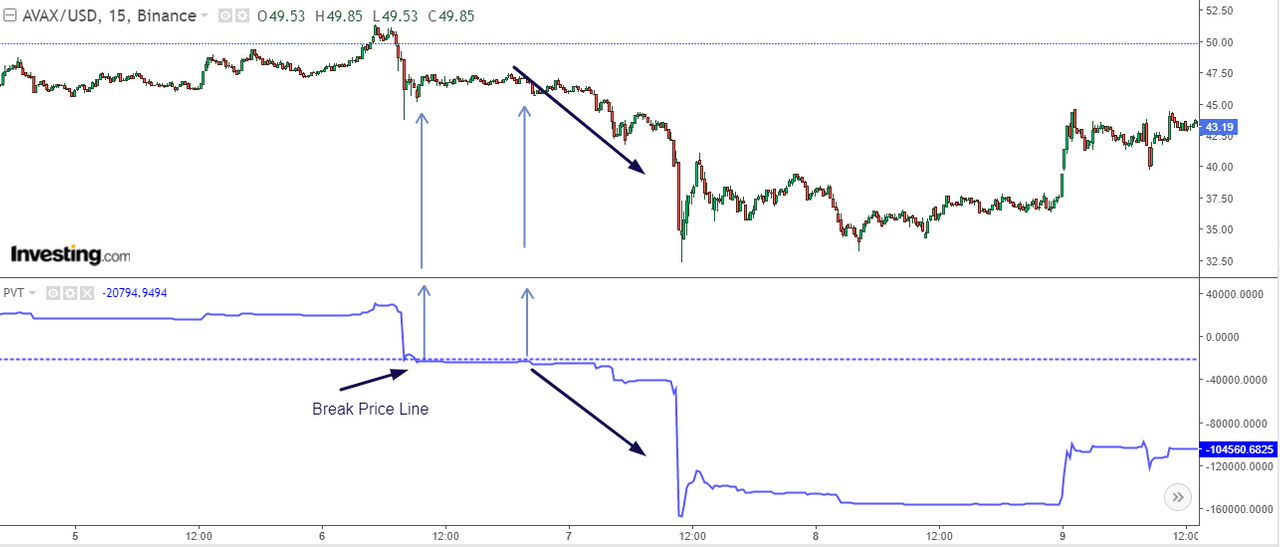 Chart with Price Volume Trend(PVT) Indicator.
Another example of Price Volume Trend(PVT), in the above image we can see from the left, the price started moving down, and then the Price Volume Trend (PVT) Indicator has crossed the price line downside which is an indication of a Bearish trend, accordingly, we can see the price trend change to Bearish Trend.
With the help of Price Volume Trend(PVT) the buyers can take their buy trade when Price Volume Trend breaks the price line upside, similarly, the sellers can take their sell trade when Price Volume Trend breaks the price line downside.
Conclusion.
In order to understand how many shares are traded in particular assets and at a specific time, the Volume indicator is can help you with these details. With the huge volume, the Volume bar will go up, and then by price trend its become easy to predict the next trend movement.
While trading with the Volume indicator we just can't focus on one Volume bar and we have to look at the price movement whether it is moving according to the volume or not, and in the correct direction, this is important to catch the false signals.
Volume indicator may look like confusing for intraday because the volumes frequently get changed, but if use Volume indicator on 1-day chart trading and use its type like Price Volume Trend(PVT) then it's good to get the strong indication.
Even volume indicators provide the information of traded total shares and also the price is moving according to it, still is it not recommended to fully depend on one indicator as Technical indicators are always 100% accurate with their signals. Hence, with the Volume indicator, we can apply one more or two indicators so that majority of indications from all applied indicators can help to see whether Volume is showing correct and more indicators provide the same indication become strong to take the right decision.
All Charts screenshots in this post are taken by me from my own study on and Chart platform used for this post is Investing.com
Comments