Steemit Crypto Academy Season 5 Week 4 [Beginner's Course] - Trading Using Rectangle Pattern
32 comments


Introduction
Hello everyone!
This is my Second lesson as a Crypto Academy Professor and I am glad that I am sharing knowledge to you all. I welcome you all to the Fourth Week of Season 5 of Steemit Crypto Academy.
This Lesson is about Trading Strategy using Rectangle Pattern.
In the Previous lecture, We studied about Recognizing patterns in Trading like Triangles, Flags. In this Lesson, We will identify Rectangle Pattern in Trading and Trading Strategy using Rectangle Pattern.
Rectangles
Think of a rectangle as a pipe which is snaking through a construction site. It has a flat or horizontal top and flat bottom touches by the price, and price is a rattlesnake making its way through the pipe.
Rectangle pattern is formed of some tops and bottoms on the Chart. Below is the example of Rectangle Pattern.
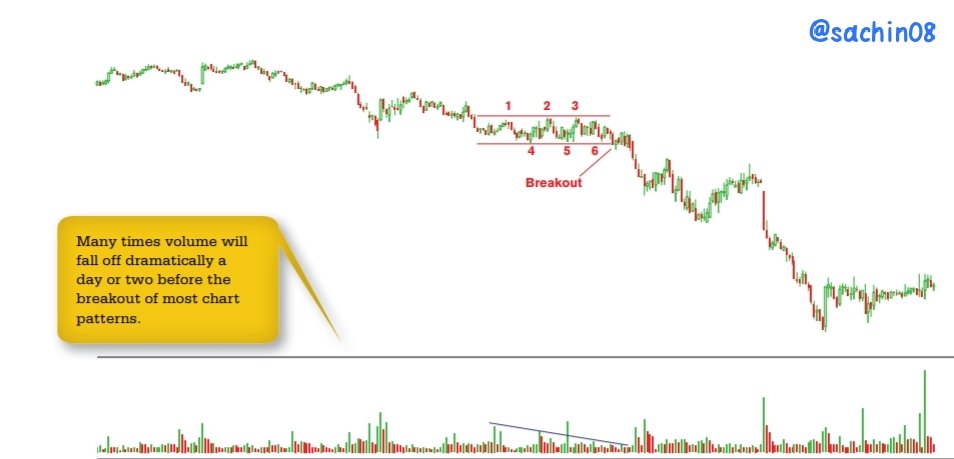
As per the above image, This Patterns consists of two horizontal trendlines. I have marked trendlines in red. One is top trendline and other is bottom trendline. Notice that Price touches each trendline three times on the top (1-3) and three on the bottom (4-6). Also Notice that the Price enters the pattern from the top and then trending downward.
The exit from the Chart Pattern is known as Breakout. In the above chart, The Breakout is in downward direction but Breakout can be in any direction for Rectangle Pattern. I have highlighted the breakout point in the Chart.
For a downward breakout, Price must close below the bottom of the rectangle to stage a downward breakout.
Notice the Volume trend. Just before the breakout, Volume makes a low level. Many times Volume will fall off dramatically a day or two before the breakout of most chart patterns (not just rectangles).
Identify Rectangle Pattern
Rectangles are rare. So, It is not easy to identify Rectangles pattern in charts. We can identify Rectangles by some points which is listed below.
| Characteristic | Discussion |
|---|---|
| Price Trend | The short term price trend leading to the rectangle is downward for bottoms and upward for tops |
| Horizontal trendlines | Two horizontal, or nearly so, trendline bound price along the top and bottom of the rectangle |
Note - In a Rectangle, Price moves horizontally between overhead resistance and underlying support.
When you are searching a chart for identifying the rectangle pattern, begin looking for a particular region where price moves horizontally. Price must bounce between a flat support zone at the bottom side and flat resistance zone at the top side.
Connect the minor highs with a horizontal or flat trendline on the top and bottom. A same trendline drawn below the minor lows which forms a parallel trendline. There should be atleast two touches of each trendline are required for a valid rectangle. The touches need not alternate from top to bottom, but should have atleast two clearly defined minor highs and two minor lows coming close to or touching each trendline.
In the similar case, the trendline touches must be spaced some along the pattern, they should not be together on one end only. In simple words, the trendline should not appear like a diving board, with one end unsupported.
Rectangle Tops and Bottoms
If We want to find whether the Rectangle is a top or bottom, then look at the price trend which leading to the start of the rectangle. Rectangle bottoms have price trending downwards into them, but Rectangle tops have price tending upward.
In simple words, We can say that Rectangle Top is formed at the top of the trend whereas Rectangle Bottom is formed at the bottom of the trend.
For Rectangle Tops, Volume often recedes over the length of the Rectangle whereas for Rectangle Bottoms, the volume pattern tends to track the breakout direction.
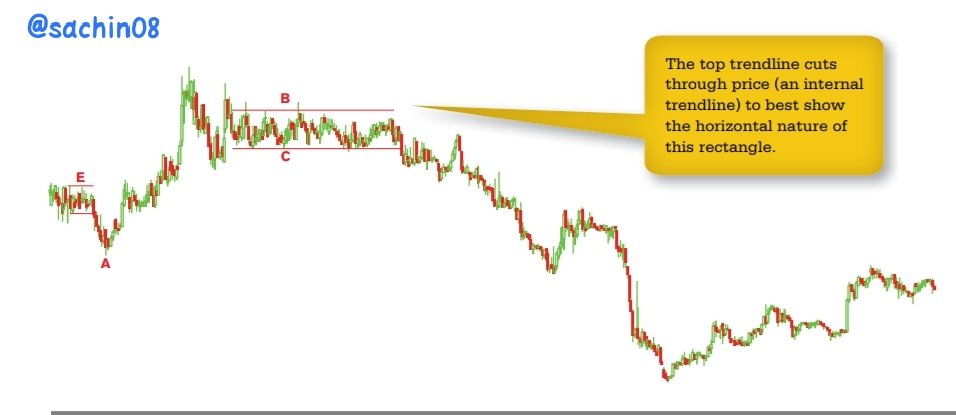
From the above image, there is a rectangle top pattern. Price makes movement between two horizontal trendlines B and C, touching each trendline three times and spread along its length.
Price begins the uptrend at A and although price bobbles up and down (before the start of rectangle), it is clear that the rectangle is at the top of trend not at the bottom.
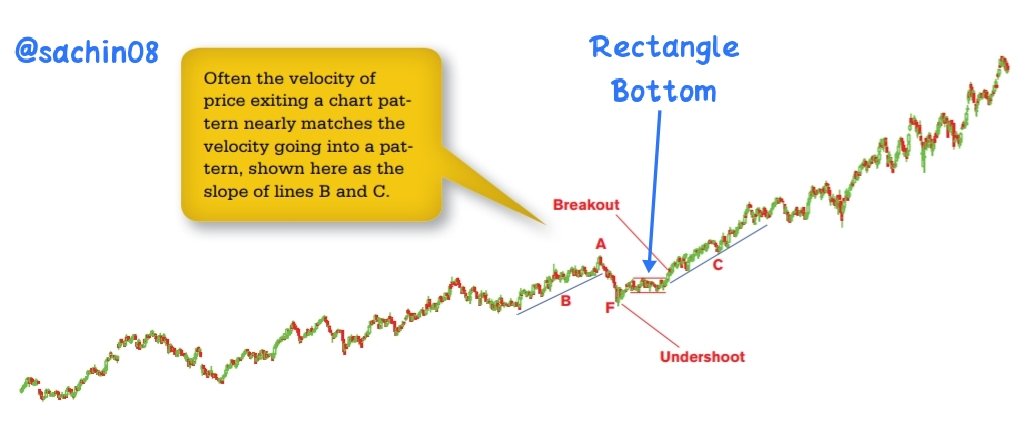
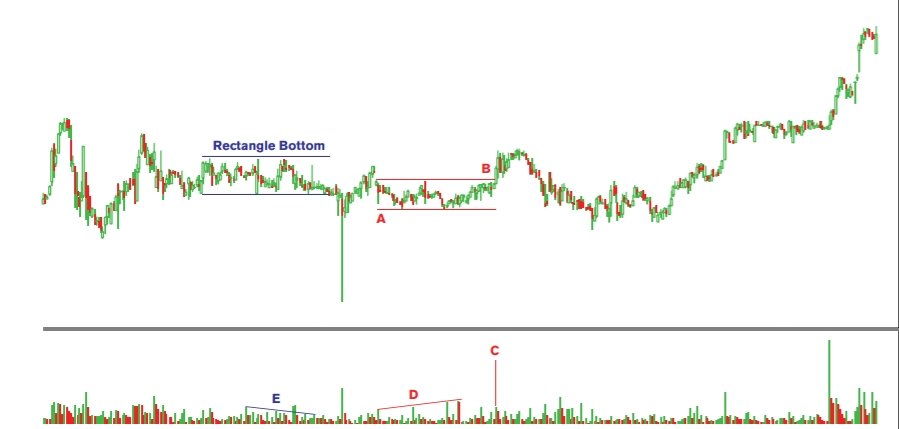
From the above image, We can notice a small Rectangle in the chart. You can zoom in the image and notice it. It is Rectangle Bottom as the Price trend higher at B and peaks at A and drops into the rectangle bottom. There, Price slides between the horizontal trendlines before breaking our upward.
Now, Let's learn two term in this pattern trading. These two terms are Undershoot and Overshoot.
Undershoot is the short dip before the start of a chart pattern and Overshoot is the short rise before the start of a chart pattern. Both Undershoot and Overshoot points occur just before a chart pattern begins. The only influence they have is to confuse novices.
Trade using Rectangle Pattern
Now, I will show you some trade setup using Rectangle Pattern.
- Buy Trade Setup
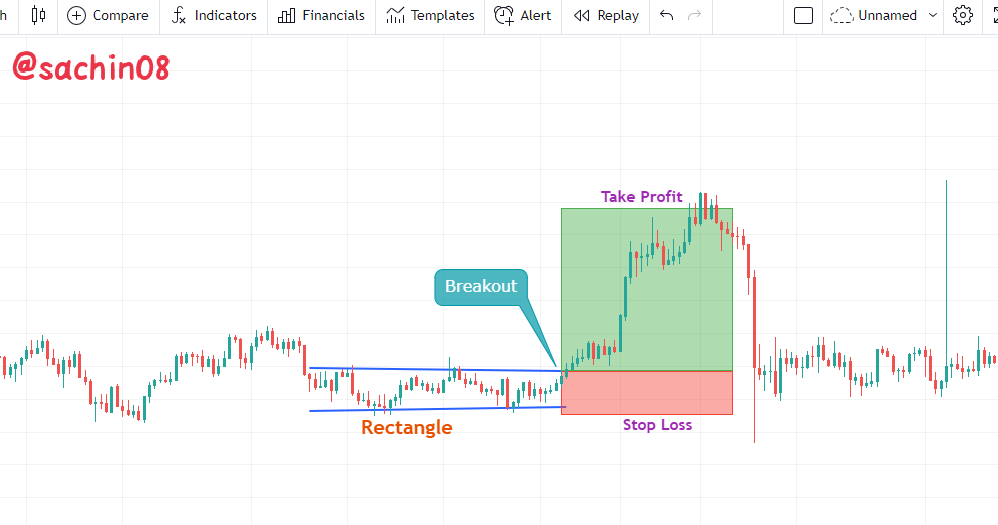
From the above image, We can see that a rectangle is formed which is touching each trendline two times and when it breaks the Resistance line, the Point becomes our entry point. At the time of Breakout, We can take our entry and then We can mark Take Profit level and Stop loss level just below the Support line.
- Sell Trade Setup
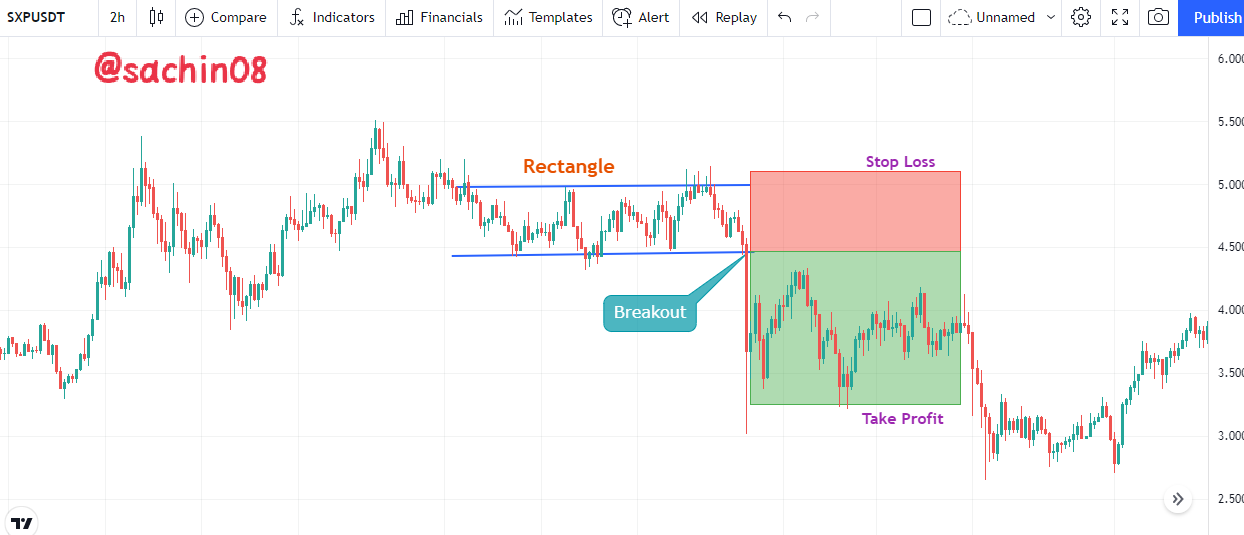
From the above image, We can see that a rectangle is formed which is touching each trendline three times and when it breaks the Support line, the Point becomes our entry point for short or We can sell our asset at that point. At the time of Breakout, We can take our entry and then We can mark Take Profit level and Stop loss level just above the resistance line.
Conclusion
In this lesson, We have read about Trading Strategy using Rectangle Pattern. These Patterns are necessary in trading.
These Patterns are often observed in the chart of Crypto assets and If We knew about these Patterns, then We can easily trade them and can make profit by trading these patterns.
Thank You for reading my lesson. If there are any error in writing, then please let me know in comments. Feel free to ask in the comment section if you have any query.
Homework Task
Make Sure you understand the lesson before performing the homework task. Also, you are required to attempt all the questions and make use of your own Crypto chart.
1. Explain Rectangle Pattern in your own word.
2. How to identify Rectangles. Explain with Screenshots.
3. Can we use indicators with this pattern to get accurate results? Explain with Screenshots.
4. Explain Rectangle Tops and Rectangle Bottoms in your own words with Screenshots of both patterns.
5. Show full trade setup using this pattern for both trends. ( Entry Point, Take Profit, Stop Loss, Breakout)
6. Conclusion
Homework Guidelines
- Homework must be posted in Steemit Crypto Academy community. Your homework title Format should be "[Your Title] - Crypto Academy / S5W4 - Homework Post for @sachin08".
Plagiarism is a great offense in Steemit Crypto Academy and it won’t be tolerated. Ensure you refrain from any form of plagiarism.
Your post should not contain less than 400 words.
All images, graphs, and screenshots from external sources should be fully referenced, and ensure to use watermark with your username on your own screenshots.
Use the tag #sachin08-s5week4, #cryptoacademy, #club5050 if eligible and your country tag among the first five tags. Also include other relevant tags like #chart, #trading #pattern.
Homework task will run from Sunday 00:00 December 5th to Saturday 11:59 pm December 11th UTC Time.
Only users with a minimum of 300 SP and having minimum reputation of 55 are eligible to perform this homework. Also, note that you must not be powering down.
Users who have used upvote tools to gain SP or build their reputation are not eligible for this homework.
To take part in the Academy you must have powered up a minimum of 150 STEEM in the past month for #club5050 eligibility.
Note: You can only drop your homework link in the comment section if not reviewed after 48 hours.
Comments