Trading Steem with the Wyckoff Method
13 comments
Greetings my fellow traders,
It's the first week of the Steemit engagement challenge for season 20 and I'm delighted to join this week's competition which is titled Trading Steem with the Wyckoff Method.
Richard D. Wyckoff who happens to be the creator of this method did that to help traders understand the behavior of the market at any point and time thereby helping them to make informed decisions. Without further ado let's get into the questions one after the other and see how we can answer them.

| Question 1: The Three Fundamental Laws of the Wyckoff Method |
|---|
Describe the three fundamental laws of the Wyckoff Method: the Law of Supply and Demand, the Law of Cause and Effect, and the Law of Effort vs. Result. Explain how each law can help predict the price movements of the Steem token within the cryptocurrency market.
Law of Supply and Demand: One of the major laws that drives the price of any asset is the law of supply and demand. Naturally, we know that when the demand for an asset is high the price goes higher but when the supply exceeds the demand the price becomes lower and this also applies to the Steem token.
This law helps to predict the price movement of the Steem token within the cryptocurrency market based on volume analysis and price behavior. Let's look at this point more closely.
Take an instance where the buying pressure for Steem becomes increasingly high which means that there is much demand for the Steem token and we have a few sellers in the market, there are possibilities that the market will pump and go higher because the demand to buy the asset is much.
Similarly, the selling pressure for Steem becomes increasingly high which means that there is much supply for the Steem token and we have a few buyers in the market, there are possibilities that the market will dump and go lower because the force to sell the asset is much.
So taking into consideration these two scenarios you can easily predict if the price of Steem will go upward or it will come downward. If there is higher demand it means the price is going up and if there is higher supply it means the price will come down.
Law of Cause and Effect: In this law, it is believed that every market behavior has a cause and the cause here includes the accumulation or distribution of the asset and the effect here talks about the price movement based on the cause.
More simply, the Law of Cause and Effect states that in every market there is always a period of accumulation i.e. buying, and a period of distribution i.e. selling, and these periods are accompanied by price movement either upward or downward.
Accumulation and distribution affect the price of Steem in the sense that during the accumulation phase, big players buy Steem at a low price and because of the demand for the asset, you will notice the price rise after a much-accumulated asset. Similarly, during the distribution phase, you will see the big players selling off their assets which means that the rate of supply at that point will exceed demand leading to the fall of the price of the asset.
To use this law in predicting the price of Steem, you must know the accumulation and the distribution phase of an asset by studying the chart of the asset. We established that in the accumulation phase, the price will move upward because the demand exceeds the supply also in the distribution phase, the price will move downward because the supply exceeds demand at this point.
Law of Effort vs. Result: As the law suggests, it takes into consideration the effort which is usually the volume behind the result which is the movement of the price of the asset. This means that if you have a large effort, you should see a large result indicating that the trend is continuing or a small result indicating a predicted trend reversal signal.
As a trader, checking the volume of the asset and the price movement, you will be able to dictate if the trend is a strong one or a weak one which is likely to lead to continuation or reversal as the case may be.
So in summary this law states that if the volume is high and the price is low or doesn't move in the same accord it simply means that the trend exhaustion is about to take place and a reversal to the opposite direction is expected.
In the same way, if the volume is low and the market price is moving strongly, it is an indication that the price of the asset may continue moving in the said direction.
The law implies that as a trader trading the Steem token, if the volume is high and the price doesn't follow suit, it is an indication that the trend exhaustion is close and a reversal is expected also if the volume is low and the price is high, it is an indication that there is going to be a continuation of that trend in that direction.
| Question 2: Cause and Effect in the Wyckoff Method |
|---|
Explain how the Wyckoff Method uses the principle of cause and effect to anticipate price actions. Provide an example of how 'cause' can be quantified (such as accumulation/distribution) and how 'effect' can be expected, using Steem’s historical price data to illustrate your point.
Wyckoff Method uses the principle of cause and effect to anticipate price actions based on the accumulation and distribution that takes place in the market which then results in the movement of the asset in a certain direction. The cause in this method is the accumulation and the distribution whereas the effect is the movement that takes place after the breaking out from either of the phases.
During the cause, big players tend to accumulate or distribute a given asset in large quantity and this is usually done during a range market and the price fluctuations are not always seen that much.
In accumulation, the big players will be buying the assets quietly and holding them and when this cycle is broken we see a price spike upward because during that time, demand has exceeded supply. Similarly, in the distribution phase, the big players will be selling the assets quietly and when this cycle is broken we see a price spike downward because during that time, supply has exceeded demand.
The principal also states that the longer the periods for either accumulation or distribution i.e. the cause the longer the price movement which is the effect. So to predict how far the market will move in whatever direction, you must know the length it took in the accumulation or distribution phase.
To quantify the cause based on accumulation and distribution, traders need to take into consideration the last movement of the asset.
For accumulation phase, is seen after a downtrend movement, when the market moves in a range for a given period anticipating a rise you can confirm the price movement and volume movement and check how long the range movement has taken that way you will know if the breakout of that range will be a massive movement or not.
For the distribution phase, this is seen after an upward movement, when the market moves in a range for a given period anticipating a drop you can confirm the price movement and volume movement and check how long the range movement has taken that way you will know if the breakout of that range will be a massive movement or not.
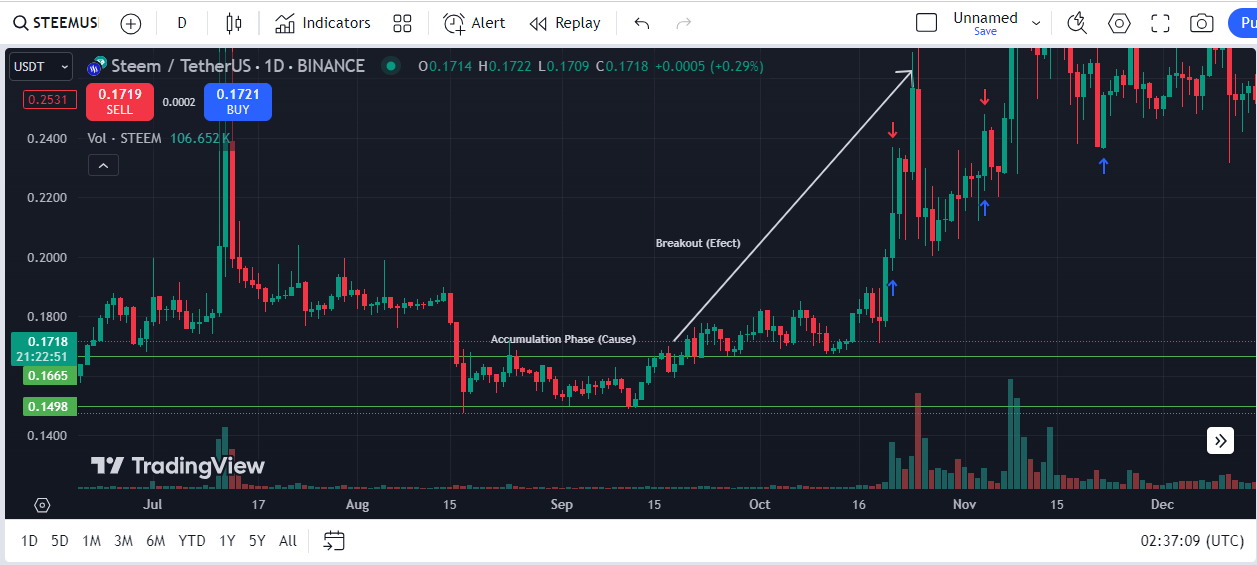
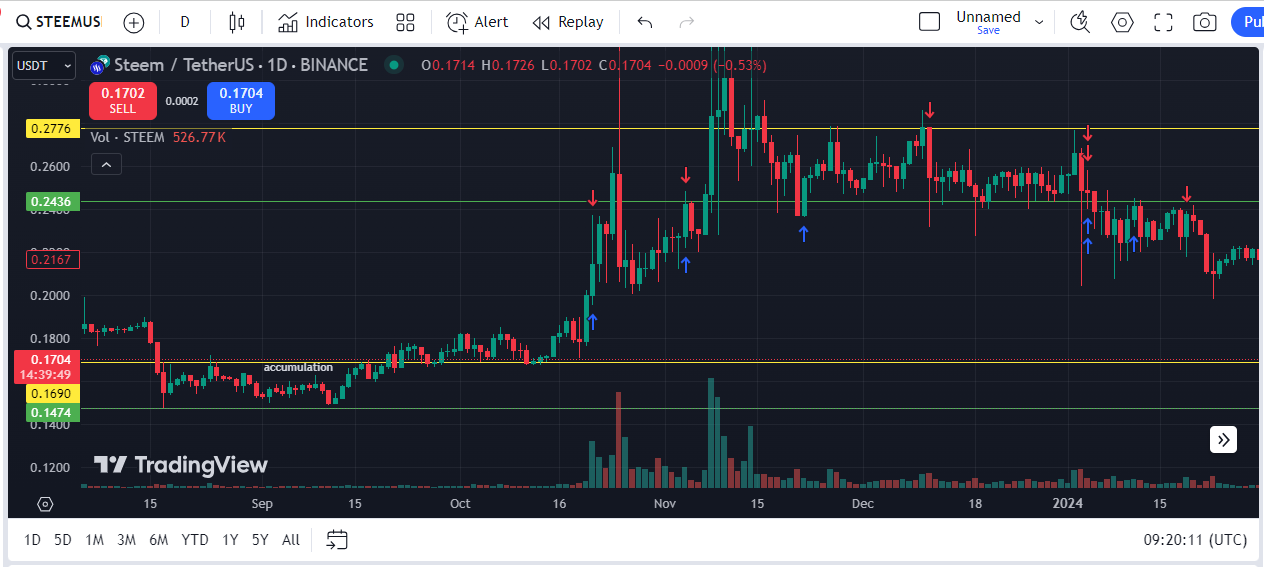
From the above chart of STEEMUSDT on a 1D timeframe, we saw an accumulation phase after a downtrend movement from 18th August 2023 through 15th September 2023 and after that, we saw how the range was broken and a market spike to the upward direction.
During the range phase which is the accumulation phase, the big players bought Steem at the range of $0.15 - $0.17 but after the phase, we saw how the price moved upward to around $0.33 which shows the effect after the cause which the accumulation.
If you look carefully at the period of the accumulation you will notice that it was prolonged a bit and that is why we have such a price movement. As we established earlier, the longer the cause the more the effect.
| Question 3: The Law of Effort vs. Result |
|---|
Explain how the Law of Effort vs. Result can be observed in the trading volume and price movements of the Steem token. Use a real chart example where this law was evident in the Steem market, and discuss what insights a trader can derive from this analysis.
In this law, the trading volume which is the effort is always compared to the price movement which is the result. If the trading volume is moving the same as the price movement then the market is in a healthy situation i.e. if the trading volume is high and the price is going high or if the trading volume is low and the price is going down it means that the market is in a good shape as it is moving accordingly.
Also, there are situations where effort which is trading volume, and the result which is price movement are not in agreement with each other. In a case where we have a high volume and there is no significant price movement, it is important you know as a trader that the market at this point shows that the trend is coming to exhaustion and a possible trend reversal is expected because of the disparity between the effort and the result.
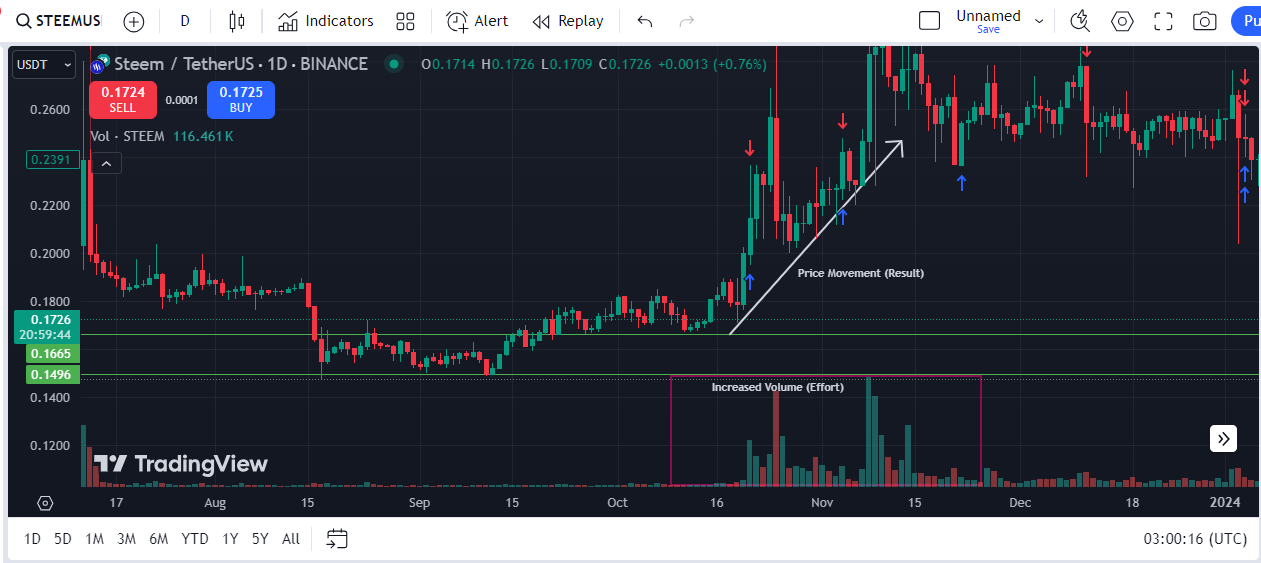
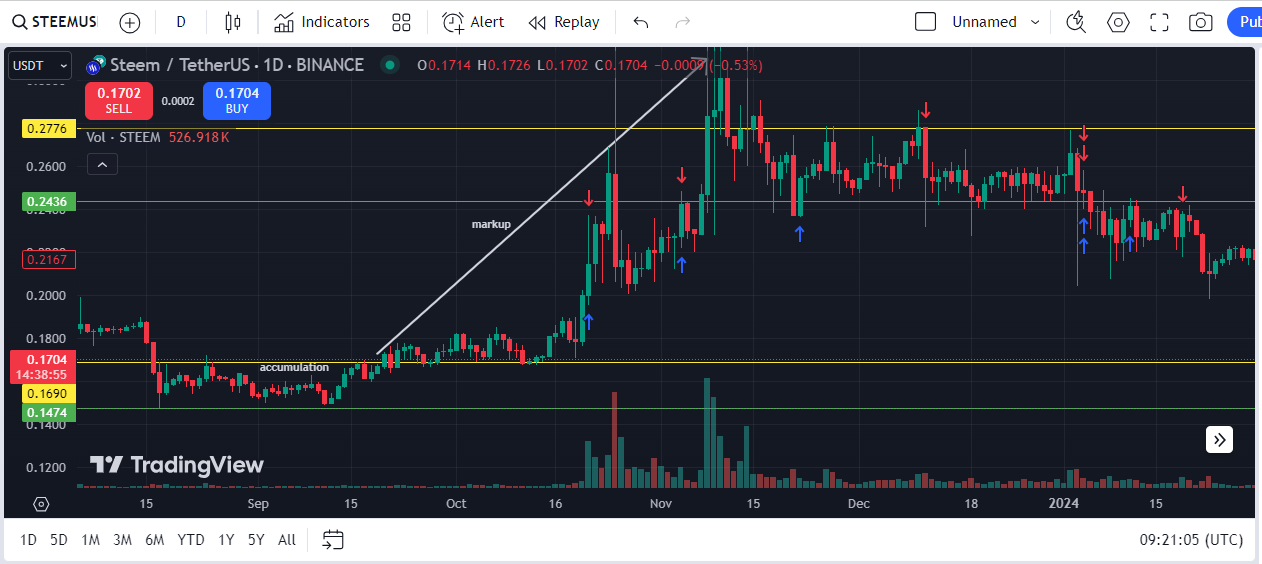
The above screenshot shows the live chart of STEEMUSDT on a 1D timeframe. From the chart, you will notice that the effort was directly proportional to the result obtained. This means that we saw an increase in volume from around October 2023 to around November 2023 and the price also moved according to the movement of the volume.
We saw how the price of the asset moved from $0.16 in October 2023 to around $0.33 in November 2023. So you see here as the volume is increasing we saw a significant rise in the price as well.
In such a situation we say that the price movement is directly proportional to the movement of the volume. This means that it moving in a trending market as expected. Another case scenario is the one seen in the screenshot below.
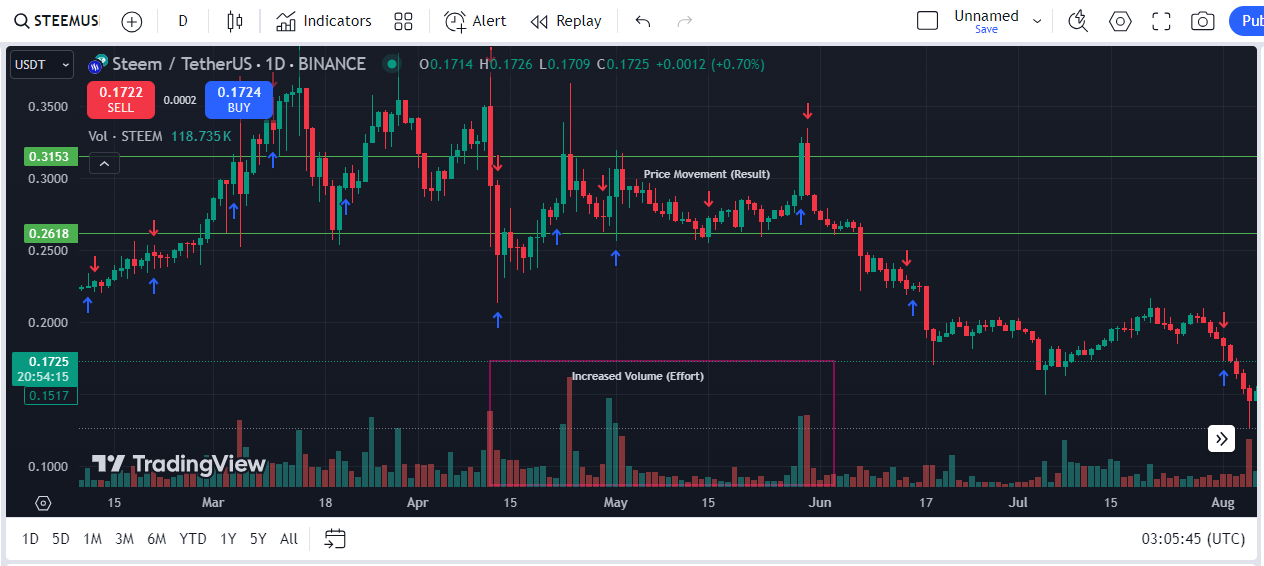
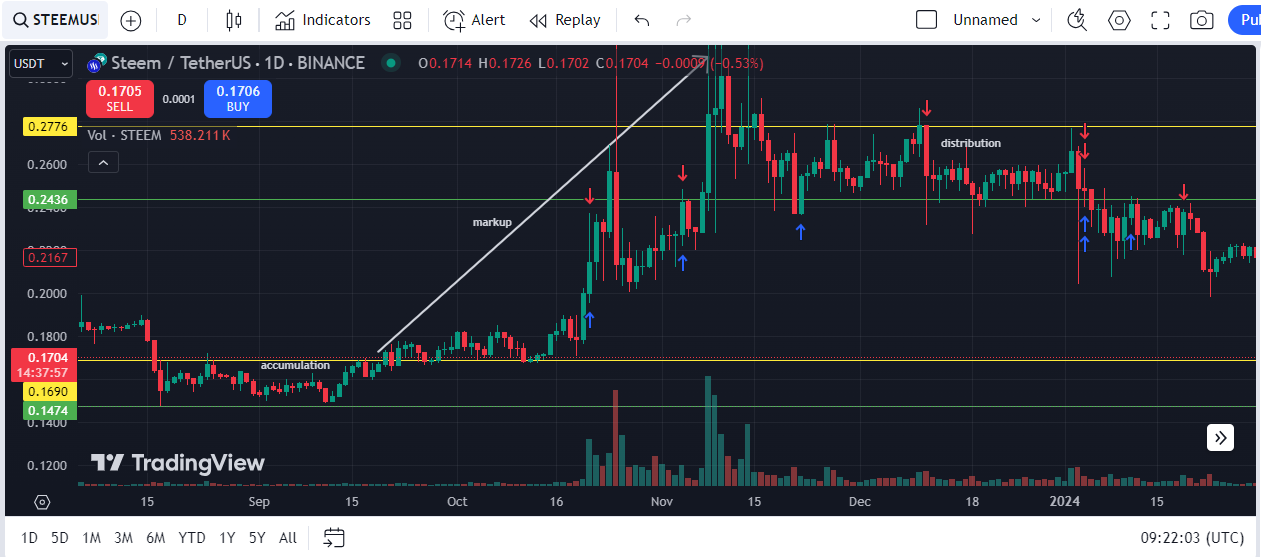
We established earlier that there are scenarios where the effort and the result are not in agreement and a good example is the image seen above. Around April 2024, we saw an increase in the volume of the asset whereas the price has little or no increase in price which implies that the trend exhaustion is almost coming to an end.
Based on the chart, we saw that the increase in Volume didn't change much in the price of the asset and immediately after that phase, we saw a trend reversal to the opposite direction which is what the market has been communicating from the beginning with the disparity between its movements.
From the above analysis, a trader should be able to know if the market will continue in the same direction if the effort and result are in agreement but if they are in disparity then the trader should expect a trend reversal and then position himself or herself for the next opportunity.
| Question 4: Key Phases of the Wyckoff Method |
|---|
Discuss the key phases of the Wyckoff Method: accumulation, markup, distribution, and markdown. Provide historical price actions of the Steem token as examples of each phase and explain how a trader can identify the current phase of the market.
Accumulation phase: One of the phases of the Wyckoff Method is the accumulation phase. This phase is seen after a long downtrend movement of an asset. After the downward movement, the price begins to move in a range showing that there is little or low volatility in the market.
Here, what the big players do is keep buying the asset at a low price and holding it and this doesn't immediately after the price of the asset as they are doing it quite. So they continue doing this until demand exceeds supply.
In this phase, a trader can identify it easily by seeing a sideways movement of the asset after a downtrend movement occurred. Also, the trader will also identify this when the volatility in the market is low but the volume is increasing which means that there is strong buying pressure. Also when the price doesn't break below the support level you will know that it is an accumulation phase.
Markup Phase: The phase that follows the accumulation phase immediately is the markup phase. In this phase we see prices rising because the demand for the asset will increase and outweigh the supply for the asset as more buyers will come into the market to purchase more of the asset.
So during this phase, because of the many accumulations, you see the price will make a sharp move before it will again pull back for others to join again. So I will discuss below how one can identify this phase and make use of it.
When you see a breakout from the accumulation phase which is the initial range movement you will then conclude that it is a markup phase. Also due to the sharp rise and pullback, the market will be forming some higher highs and higher lows. Also, you will notice that the volatility of the market has increased because of the fast rise and pullback in the market.
Distribution Phase: This phase is the direct opposite of the accumulation phase. After an uptrend movement, the market will get to a stage where the movement will become a range market, and in that phase, the big players will start selling their accumulated assets. Buyers are still in the market which will keep the price in range for the time being.
Here in this phase, there may be an increase in volume as well as volatility but the price range won't be much as there will be not much significant movement.
To identify this phase, you will notice a sideways movement after a long uptrend movement. Also, you will notice that the volume is increasing and the price is in the range and doesn't go above the resistance level, since the price doesn't break above the resistance then it is clear that the phase was a distribution phase which big players have started selling and after a while, you will notice that price will drop.
Markdown Phase: The last phase is the markdown phase and this occurs immediately after the distribution phase when the supply of the assets outweighs the demand for the assets. Here the big boys may have finished selling and once they are out of the market you will notice a sharp decline in the price of the assets.
Now to identify this you must first identify a distribution phase which is a range movement after an uptrend. When the range is broken and the price moves downward it means that the markdown phase has started. During this price movement, you will see the market making lower highs and lower lows.
Identify the current phase of the market.
In other to identify the current phase of the market using this strategy, you must take into consideration price action and the volume indicator for your analysis. So based on the 4 phases I have discussed above, you can easily know which is the current phase and the next movement you should expect.
For Clarity purposes, I will still discuss it in summary here.
Accumulation: For the accumulation phase, you must be sure that the market has a prolonged sideways movement after a downtrend movement that occurred initially. So when you see this you will know that the phase is the accumulation phase.
Markup: Here in this phase, you will see a breakout of the price action from the range market which was seen in the accumulation phase. A sharp movement upward and also pullback will be seen in this phase.
Distribution: For the distribution phase, you must be sure that the market has a prolonged sideways movement after an uptrend movement that occurred initially. So when you see this you will know that the phase is the distribution phase.
Markdown: Here in this phase, you will see a breakout of the price action from the range market which was seen in the distribution phase. A sharp movement downward and pullback will be seen in this phase.
| Question 5: Applying the Wyckoff Method |
|---|
Outline the step-by-step process for applying the Wyckoff Method in trading the Steem token. Discuss how to identify the accumulation phase, signs of supply/demand tests, and the transition to a markup phase. Use a real example of the Steem token to illustrate entry and exit points based on the Wyckoff Method.?
The basic steps to apply the Wyckoff Method in trading the Steem token are what I have explained clearly in the previous question. For the sake of this question, we are still going to elaborate on it again. So without wasting our time let's go ahead to start.
Step 1: Accumulation phase, this can be seen during a prolonged sideways movement usually after a downtrend movement. Here the big players will buy a lot of the assets at a lower price when the market is still ranging and no significant change will be seen in the price.
You can note this by checking price action which is a sideways movement after the sharp decline of a price downward. You will also see the volume increasing indicating that there are buyers in the market though the price here will not show it as they are silently accumulating.
Step 2: Supply & Demand test, here we check if the pressure to buy is higher than the pressure to sell. When the buying pressure exceeds the selling pressure then, you will anticipate a price pump. So what you can see in this step include;
You will notice the price breaking the support level to do away with those who don't have much and when that is done it goes back to the range region again telling you that the buying pressure is much and that of selling is small. Also after that, be sure to see a breakout above the resistance telling you that the buying pressure is high. You will also notice a retest to correct itself before moving further.
Step 3: Confirm transition to the markup phase. Here you will notice a breakout of the price of the asset within the previous range it found itself before. So in this place, once you confirm that then you are good to go as you have identified markup which is the next phase after accumulation.
Step 4: You may want to use the opportunity here to enter the market when the opportunity presents itself once again. Since this phase, we see the market making higher highs and higher lows, you can long or buy the market after a pull back taking into consideration the volume of the asset.
Step 5: Distribution phase, here you will see a prolonged sideways market after an uptrend. Here during this range phase, the big boys will start selling their assets but other traders won't notice because they are still buying.
Hereafter much struggle, the supply will become higher than the demand for the asset because the big players are the people who have caused the market such an impact as they sold most of their holdings.
Step 6: Immediately after the distribution phase, the markdown phase follows suit. Hereafter, you will notice a sudden decline in breaking the range and moving below the support level.
Step 7: You can repeat the cycle over and over again anytime you wish to make another move in the market using this same method.
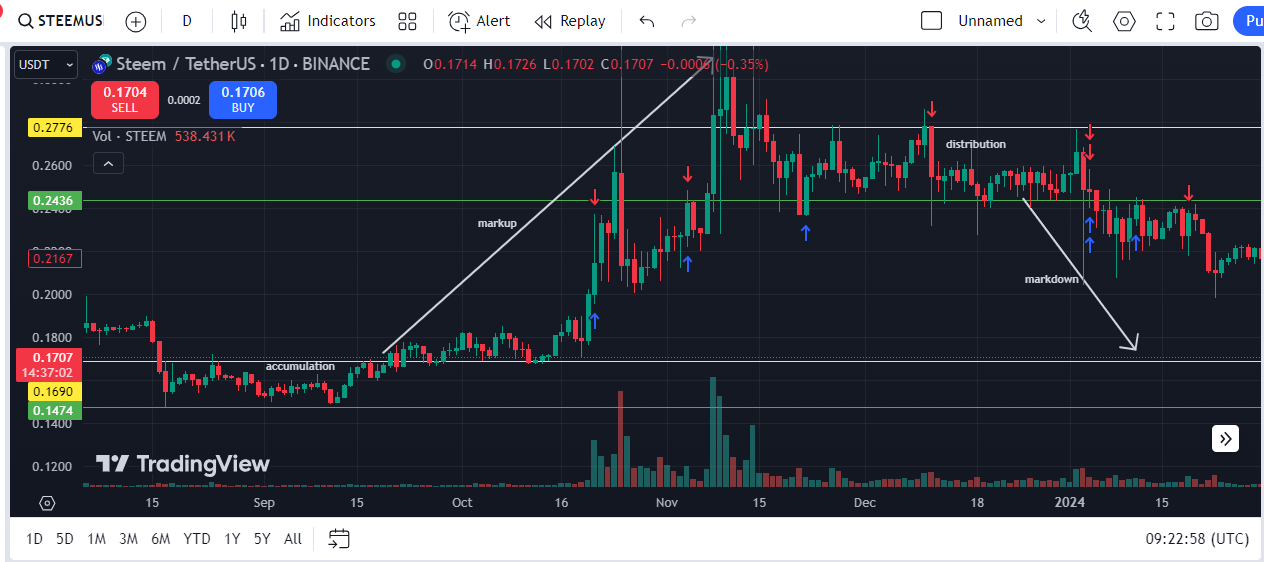
To enter and exit the market using the Wyckoff Method, let's consider the screenshot below. From the screenshot, you will notice where I indicated the buy entry and the sell entry as well as their exit. I will explain below how I got these levels.
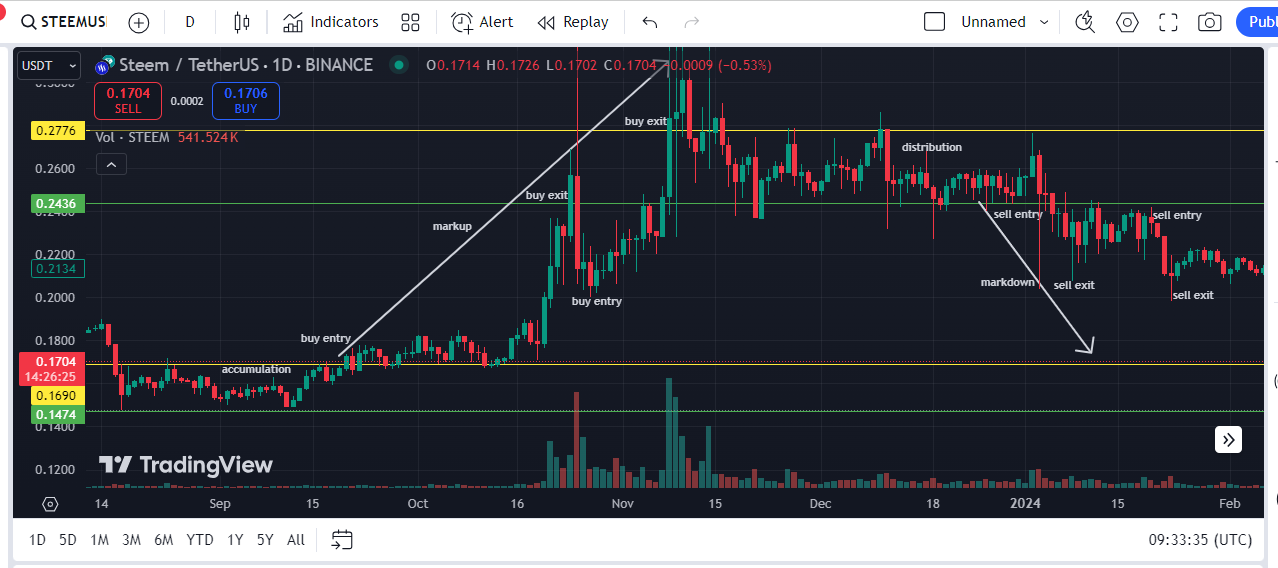
After the accumulation phase, the next phase is the markdown phase which is the breakout of the range phase and an upward movement. You can wait and enter the market immediately after the breakout from the accumulation phase as seen above. You will exit the market also when there is a pullback and enter again when the market wants to continue moving upward.
For the sell entry, you are to enter after the distribution phase immediately after there is a breakout leading to the markdown phase. You can also exit when there is a pullback and enter again when the market wants to continue moving downward. I have marked all these levels for your information in the chart.
Finally, I want to invite @suboohi, @patjewell, and @ripon0630 to also join the contest and share with us their thoughts on Trading Steem with the Wyckoff Method.
Comments