Crypto Academy Contest / S20W1: Trading Steem with the Wyckoff Method
7 comments
Hi, Steemians How are you?
canva editing
Question 1: The Three Fundamental Laws of the Wyckoff Method
The Wyckoff Method has three basic rules that help understand and predict trends in any financial market including cryptocurrencies. Lets look at these three laws in detail and understand how they can affect the price movements of the Steem token.
- Law of Supply and Demand
According to Wyckoff the fundamental principle of any Market price change is supply and demand. If demand is high And supply is low prices will go up and if supply is high And demand is low prices will go down.
Application to Steem Token Price: If the demand for Steem increases for Example the arrival of new users on Steemit or the need for the token increases at a particular time its price will be Expected to increase. Conversely if people are selling a lot of Steem and there are few buyers the price is likely to fall.
- Law of Cause and Effect
This law states that behind every major movement in the market there is a "cause whose effect is seen later. This reason is mostly due to the activities of large market players (institutional traders) who are busy building or liquidating their positions during a particular period of time.
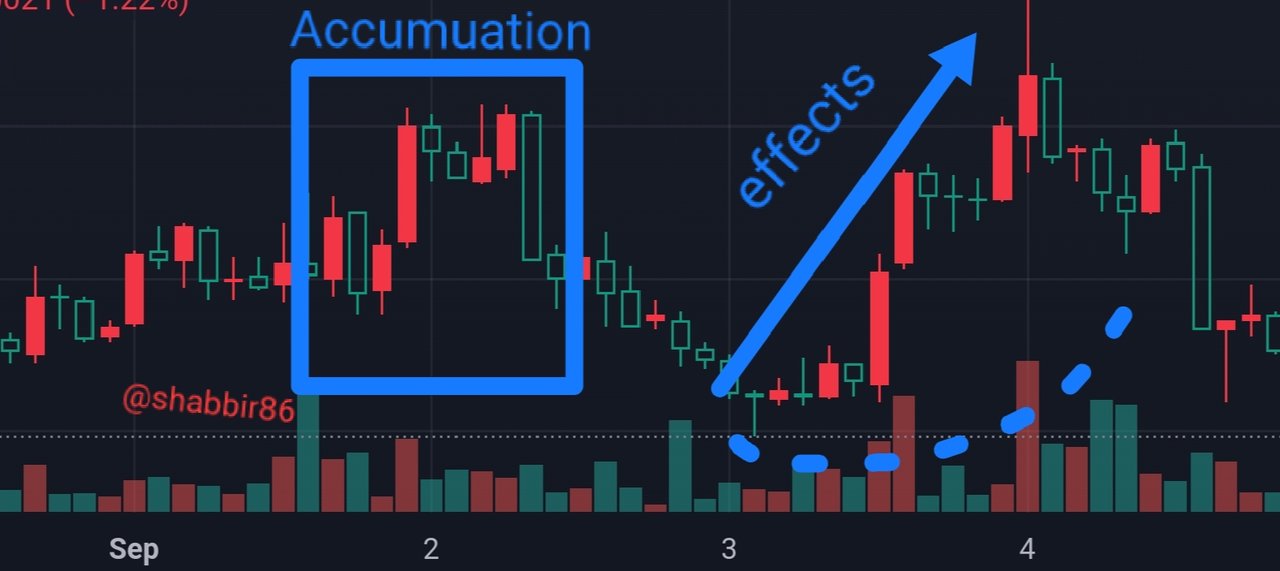
Application in Steem Token Price: Before a big change in the price of Steem there may be a pause (accumulation or distribution) in the market, where large investors are building their positions. During this time, the price is moving in a range, and when this process is complete, the price can make a big move. This law tells us what is happening in the market before a big price move.
- Law of Effort vs. Result
According to this law there is a close Relationship between price Movement and trading volume in the market. If there is a large price move but trading volume is low, the move may be temporary. Likewise, if both volume and price movement are in sync, it indicates a strong trend.
Application to Steem Token Price: If the price of Steem is rising but the volume is low, the movement may not be sustained and the price will fall again. But if the trading volume is increasing along with the price increase, this can be a strong signal that the price increase is stable and may go higher.
Result:
These three rules of Wyckoff Method can be very helpful in predicting the price of Steem token. The law of supply and demand can be used to understand which direction market forces are moving. The law of cause and effect can predict the state of the market before large changes in price occur. Whereas the law of effort versus result shows the extent to which there is a correlation between price movement and volume, which can be used to gauge the strength of trends.
Question 2: Cause and Effect in the Wyckoff Method
The Wyckoff Method, is a technical analysis method that uses the principle of cause and effect to predict price Movements. According to This principle every major price movement is the result of a specific cause, which we see in the process of technical accumulation or distribution. According to Wyckoff the amount of cause(Cause occurs when major players or investors in the market are accumulating (Accumulation) or distribution Distribution and its effect (Effect) is reflected in the rise or fall of prices. It happens.
Formation of Cause by Accumulation and Distribution
Accumulation means That investors are buying assets (e.g. Steem coins) at low prices, so that they can sell them later when the price rises. This action is considered "caused" because it causes the price to rise in the future.
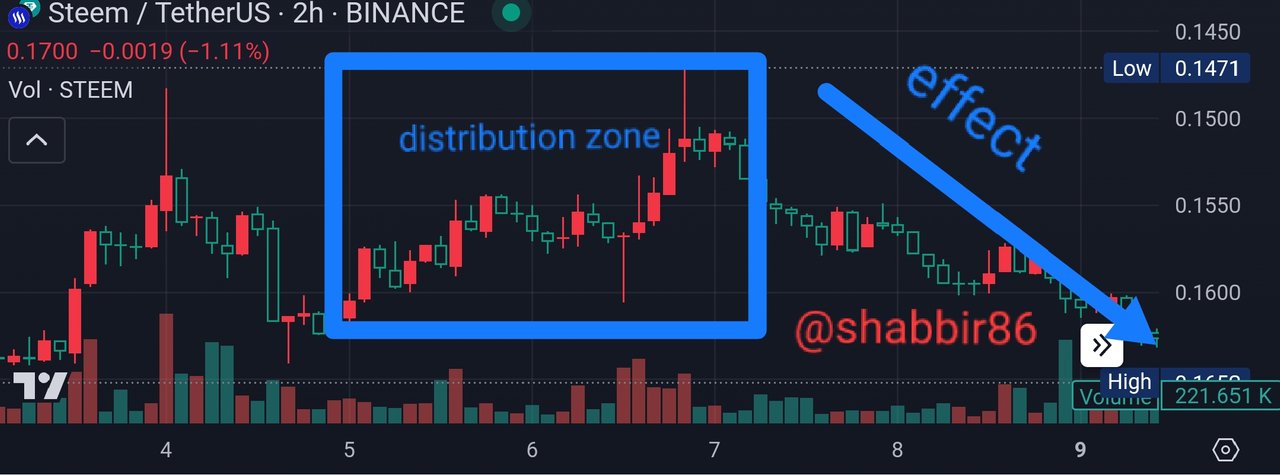
Whereas Distribution is the opposite, where investors are selling their assets at higher prices. This process is also considered "caused," because it causes the price to fall in the future.
Prediction of Effect
In the Wyckoff Method, the Effect determines how large a change in price will be caused by the Cause. If Accumulation continues for a long time, it can be expected that there will be a big price increase. On the other hand, if the distribution process is taking place, it can be expected to reduce the price significantly.
Using Steem historical price data
Let's say that in Steem's historical price data we see a long period of steady buying at low prices. This indicates Accumulation and according to the Wyckoff Method, it is an indication that there will be a big increase in the price of Steem in the future. On the contrary, if we see that the price of Steem has reached a major level followed by increasing selling pressure, this indicates a distribution, which means that the price is expected to fall.
For example, if the price of Steem stays at $0.10 for a long period of time and we see a large number of coins being bought (accumulation), then according to Wyckoff's principle this will cause the price to increase. Later when Steem reaches $1.00 and we see massive selling activity, this will be a bearish signal.
The result
The principle of Cause and Effect in the Wyckoff Method is very important for understanding price movements. Accumulation and Distribution phases are considered as causes, and their effects as price changes.
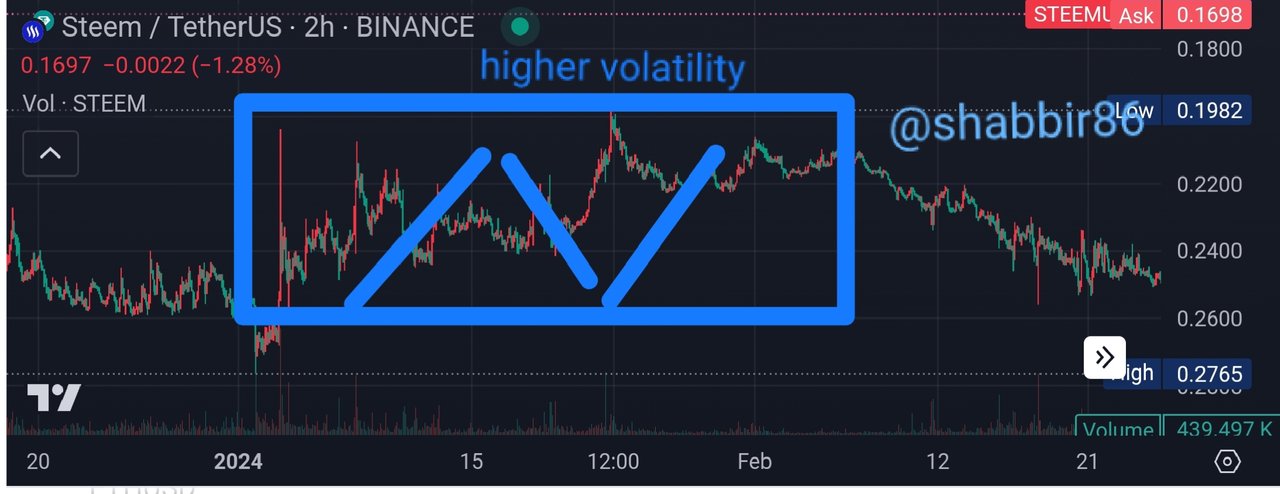
Question 3: The Law of Effort vs. Result
Effort vs. The Law of Result: Observations in Steem Token Trading Volume and Price
Effort vs. The Law of Result tells us that there is not a proportional relationship between effort and result in different financial markets. That is, sometimes despite high trading volume (effort) there is a small change in price (result), and sometimes with low volume a large change in price is seen.
Observations on the Steem Token market
Let's take a real example of Steem token price and trading volume. Let's say that on a particular day in the market the trading volume of the Steem token was unusually high, but the price changed little. This situation reflects that the result remained weak despite high trading volume.
Conversely, another day when the trading volume was low, but the price rose remarkably. This is Effort vs. The Law of Result is where a greater result (increase in value) is observed with less effort (less volume).
Chart example
For example, if you look at the trading volume and price movement on a chart of the Steem token, you will notice that some places have large price movements while the volume is low, and some places have a lot of price movement despite high volume. Little changed. This is where Effort vs. The law of result is clear.
Insights for traders
Traders can learn from this law that predicting price by looking at trading volume alone is not always effective. Big results aren't always the result of more effort. A trader should understand the various factors in trading and notice when there is no significant change in price despite high volume in the market. Such insights can help them make better decisions.
Effort vs. Result analysis helps a trader understand when the market can have significant price movement even with low volume, and when the market remains static despite high volume.
Question 4: Key Phases of the Wyckoff Method
The Wyckoff method is an important method of studying price movements in financial markets that helps traders identify different phases of the market. This method includes four main steps: Accumulation, Markup Distribution, and Markdown. We examine the historical price movements of the Steem token to understand these phases and how a trader can recognize the current market phase.
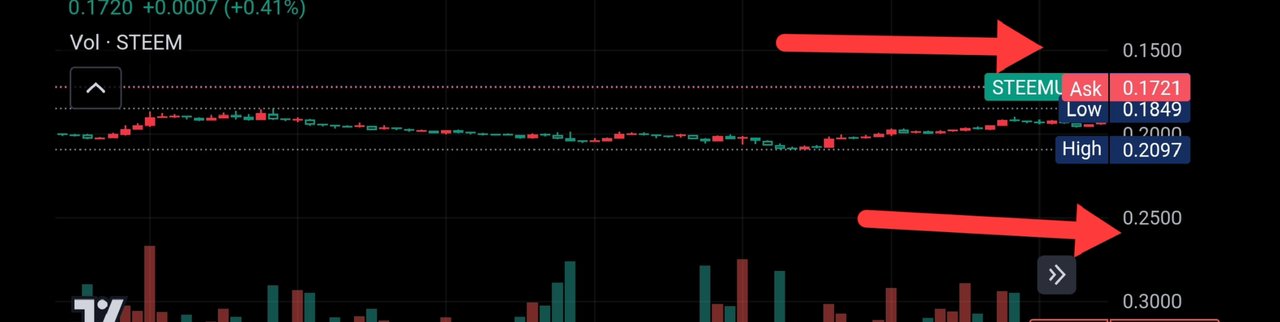
- Accumulation phase
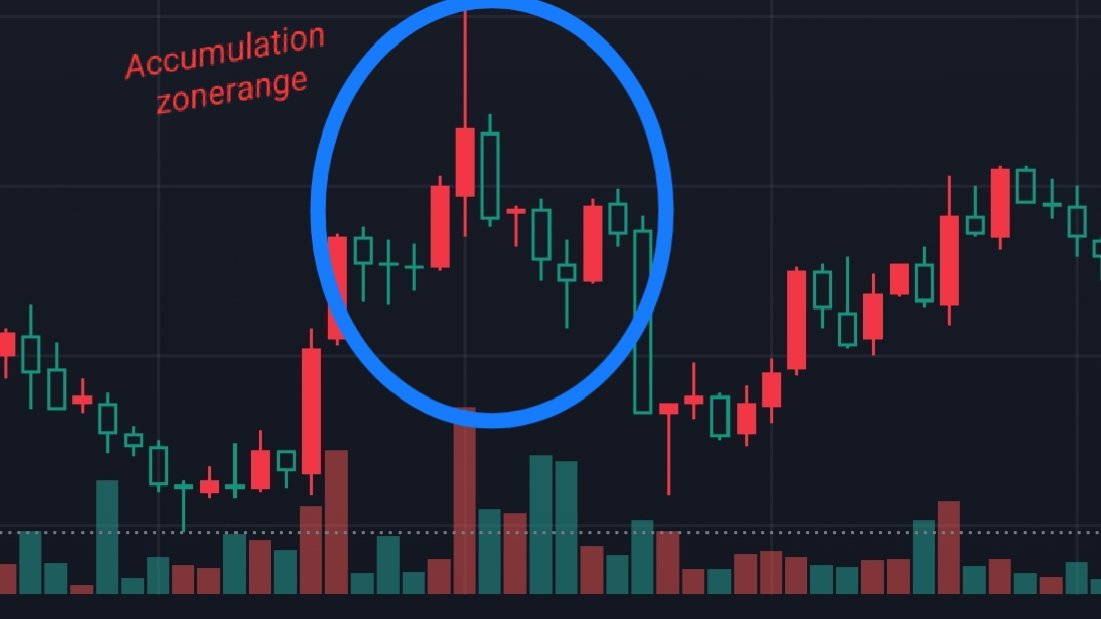
Accumulation is the stage when large investors or "smart money" start buying assets at the low point of the market. In this phase, prices usually remain within a limited range and the downward momentum of the market is slow. Buyers start showing interest in the market, but till then there is no big change in price.
Steem Token Example:
Let's assume that the price of Steem token has not had a big movement for a long period of time and is trading in a limited range after a steady downward movement. This could be a sign of accumulation where large investors are buying Steem, expecting the price to rise in the future.
Identification Method for Traders:
Traders can recognize an accumulation phase when prices are trading in a limited range and there is a slight increase in market volume. In this phase of The downward direction of prices Stops And the signals of an upward movement are shown.
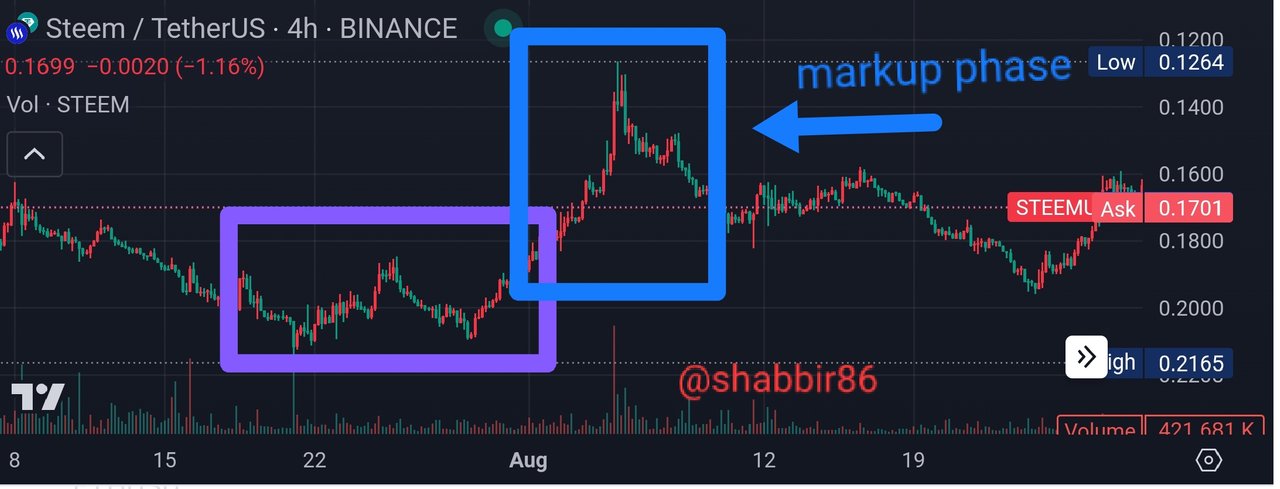
- Markup phase
Markup is the stage when prices start to go up and the Markets starts buying big. In this phase, public interest increases, and the price moves rapidly upwards.
Steem Token Example:
If the price of Steem is experiencing a sharp rise and the token is trading at a consistently high price, this may be a markup phase. Currently, the number of Steem buyers increases, and positive trends are seen in the market.
Identification Method for Traders:
Traders can look for sustained upward movement in price and high volume to identify a markup phase. This is a sign That more buyers are coming into the Market and prices are expected to go higher.
- Distribution phase
The distribution phase is when Large investors or Smart money begin to Sell their assets. In this phase, prices fluctuate, but the market trend is stable and a big sell-off is being prepared.
Steem Token Example:
When Steem's price reaches a level and is fluctuating and showing no clear direction, it may be a distribution phase. Meanwhile big investors are exiting the Market by selling their tokens.
Identification Method for Traders:
A distribution phase can be recognized when prices stabilize in a range and there is no apparent increase in volume in the market. This is a sign that large investors are selling their assets.
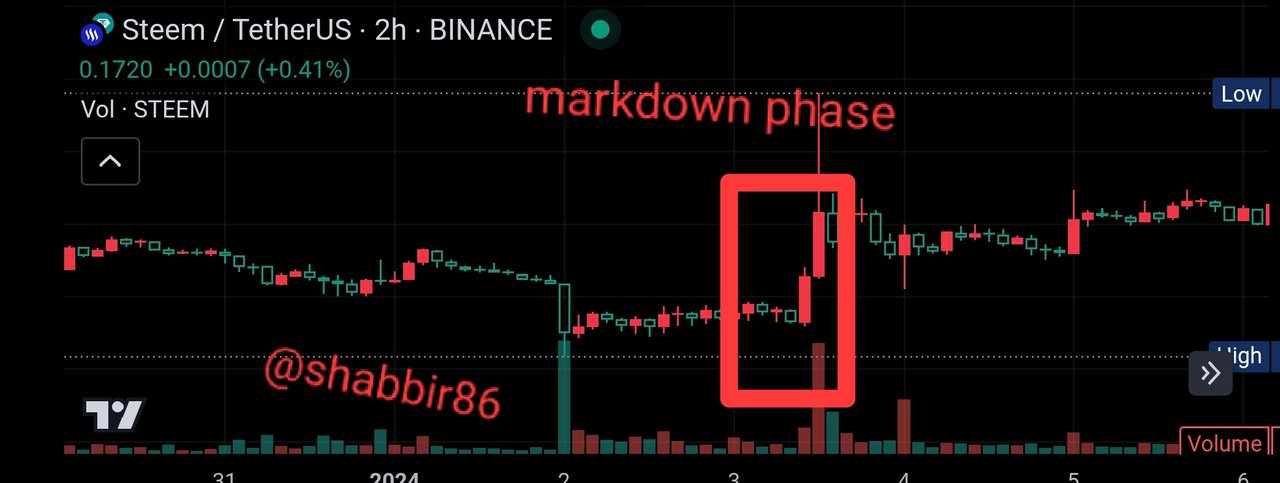
- Markdown phase
Markdown is the stage when prices start to drop sharply. This happens when most market participants sell their assets and selling pressure builds up in the market.
Steem Token Example:
Suppose the price of Steem is falling rapidly and the selling pressure becomes too much. This may be the markdown phase where traders are trying to sell their tokens quickly.
Identification Method for Traders:
The markdown phase can be identified when prices are falling sharply and volumes are increasing. This is a sign that selling pressure is high in the market and further price declines are expected.
The result
The Wyckoff method Helps traders understand the different phases of the market allowing Them to Make better decisions About when to buy and when to sell. The Historical movements of Steem Token price help us to understand these phases and help traders to recognize the current market phase.
Question 5: Applying the Wyckoff Method
The purpose of using the Wyckoff method in trading is to understand major market trends and predict price movements. To apply this method, we analyze different phases, such as accumulation, supply/demand test, and markup phase. Let's understand this method with the example of Steem Token.
- Identify the accumulation phase
The accumulation phase begins when the price of an asset (such as a Steem token) stabilizes after a decline. Meanwhile, big investors start buying but don't let the price rise suddenly.
Symptoms of Accumulation:
The price is near the lowest level.
Trading volume is decreasing.
Price should move within a limited range (i.e. sideways movement).
Example:
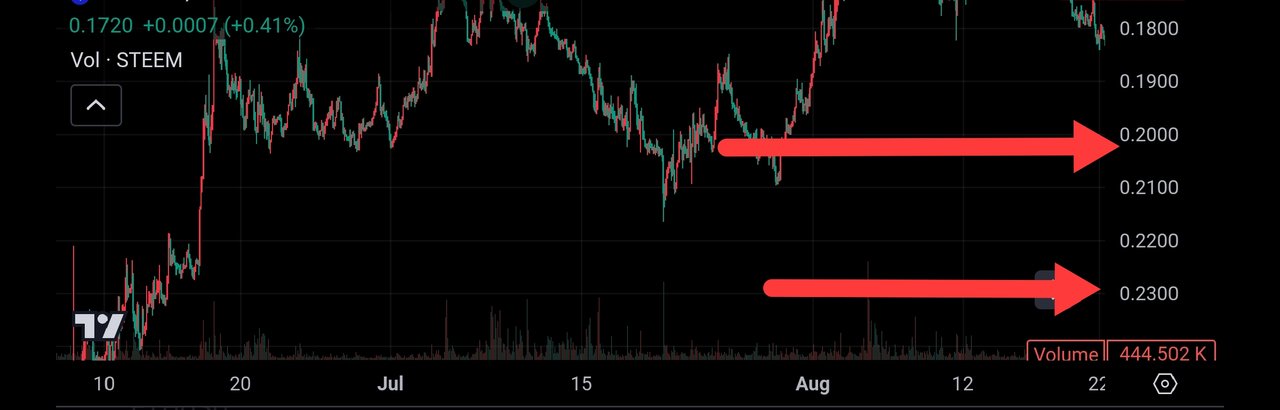
If the Steem Token price is limited between $0.15 and $0.25 for several months and there is a clear decrease in volume, this may be a sign of accumulation.
- Supply and Demand Test
A test of supply and demand is the stage where large investors sell small quantities to gauge market strength. If the price remains stable rather than falling, it is an indication that demand is high and the price may rise.
Symptoms of Supply/Demand Test:
Return immediately after the price drops.
A slight increase in trading volume.
Example:
If the price of Steem Token drops below $0.20, but immediately goes back to $0.23, then this can be a demand test.
- Start of Markup Phase
The markup phase is the phase when The price starts to increase, significantly. This occurs when accumulation is complete and demand exceeds supply.
Symptoms of Markup Phase:
Price breaks Through key resistance levels And moves higher.
A steady increase in volume.
Example:
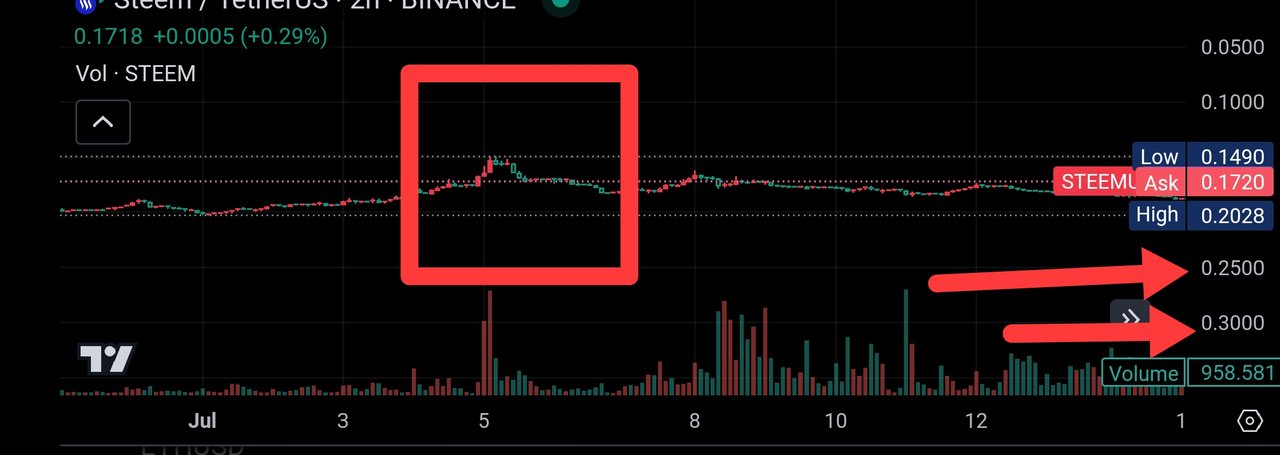
If the Steem Token price breaks the critical resistance of $0.25 and reaches $0.30 and the volume continues to increase, this is the beginning of the markup phase.
- Determination of entry and exit points
Entry Point: An entry should be taken when the price starts moving out of the accumulation zone and breaks the first resistance level.
Exit Point: When a clear resistance is seen at new resistance levels after a price rally and volume begins to decline, this is an exit signal.
Example:
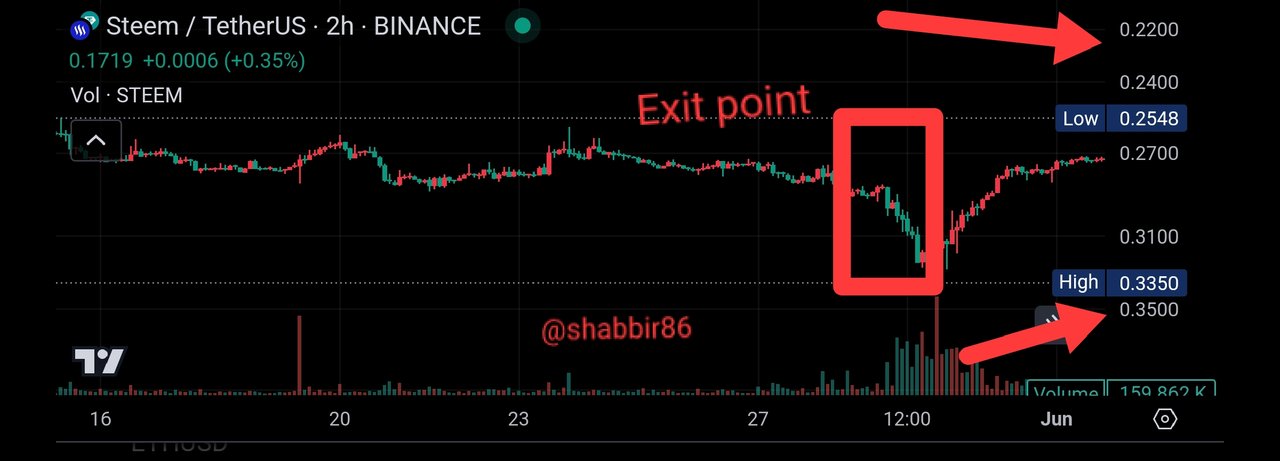
If you bought a Steem token at $0.20 and the price stops at $0.35 and the volume decreases, this could be an exit point.
Result:
Applying the Wyckoff method correctly helps to understand major market phases. Even in Steem Token this methodology can be used to understand market cycles and make better trading decisions.
Conclusion
The Wyckoff Method provides a structured approach to understanding market trends and predicting price movements, especially in volatile markets like cryptocurrencies. By analyzing the laws of Supply and Demand Cause and Effect, and Effort vs. Result traders can anticipate price fluctuations and make informed decisions. Recognizing the key phases—accumulation markup distribution and markdown—allows for identifying optimal entry and exit points in trading. Applied to Steem Token this method can guide traders in navigating market dynamics And improving their Trading strategies for better outcomes.
I Would like to invite @josepha @stef1 @patjewell @suboohi to take part in this contest
Here is Contest Link
Cc,
@kouba01
Note All Screenshot take from tradingview app
Best Regard @shabbir86
Comments