Crypto Academy S4 | Intermediate Level Course for Week 8 : [How to Trade Cryptocurrencies Profitably Using TD Sequential ] by @reddileep
20 comments

Cover Image Created by Adobe PS
Hello Steemians!
After seven weeks in the Steemit CryptoAcademy, we are now in the eighth week of Season 4. So, as usual, today I have brought another very interesting lesson which is about "How to Trade Cryptocurrencies Profitably Using TD Sequential"
Today I am really going to talk about an indicator that is very useful in trading. We can use this indicator specifically to identify market reversals and corrections. So let's go straight to the lesson.


If we look at the contents of this indicator we can see that this is a fairly complex indicator. Primarily, this indicator consists of two phases.
TD Setup
TD Countdown
Of course, there may be a number of other phases in addition to the ones included above such as TD support levels, TD resistance levels and any other different modified variations. Today, however, I would like to explain the two phases mentioned above and I will go into more detail about TD Setup as it is more useful.
Here we have to use the Japanese Candlesticks chart pattern for analyzing our charts using this indicator. Because we have to consider the behaviour of each candle one by one.
As I described earlier, we can find trend reversal points using special counts. That means we can see a special number above or below some candles. In fact, these numbers refer to two setups. That is TD buy setup and TD sell setup. The first thing to understand is that a TD buy setup occurs when the market goes down. In the same way, TD sell setup occurs when the market goes up. However, you may think I am wrong here. In fact, we should make purchases not when the market is high but when the market is low. This is where we can make the most profit. Many people make losses in the market because of this mistake. In the next subtopics, I will explain this further and explain how to analyze charts using these setups.

When we discuss the TD setup, there are two setups. The first is the TD buy setup and the second is the TD sell setup. So there are two setups for buying and selling and the above-explained numbers are related to these setups.
The first point is that a TD Buy setup occurs when the market goes down. Similarly, a TD sell setup is formed when the market goes up. So one would think that this should happen on the other side. Actually, this is the right way. Because we need to look for opportunities to buy right when the market is dumped. Only then can we buy the relevant coin at a lower price.
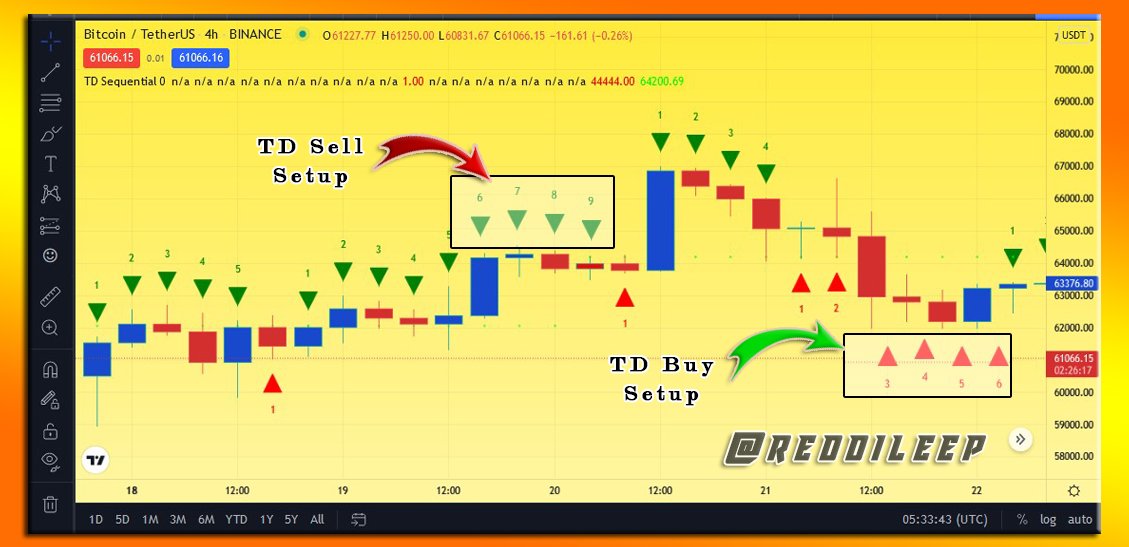
If we discuss the appearance of the indicator, the numbers corresponding to the TD sell setup is shown in green colour above each candle. Same like that, the numbers corresponding to the TD buy setup is shown in red colour below each candle.
Screenshot was taken from https://tradingview.com


First of all, let me show how these numbers are displayed in relation to a sell setup. We already know that a sell setup is formed when the market goes upward. Below conditions must be present for a sell setup to form when the market is really going upward.
After the market has gone a significant downward trend, that is, at least one Bearish candle is formed in a higher time frame and then bullish candles begin to form. This is how we call a price flip to switch from a Bearish candle to a bullish candle. This should be the first thing that needs to happen.
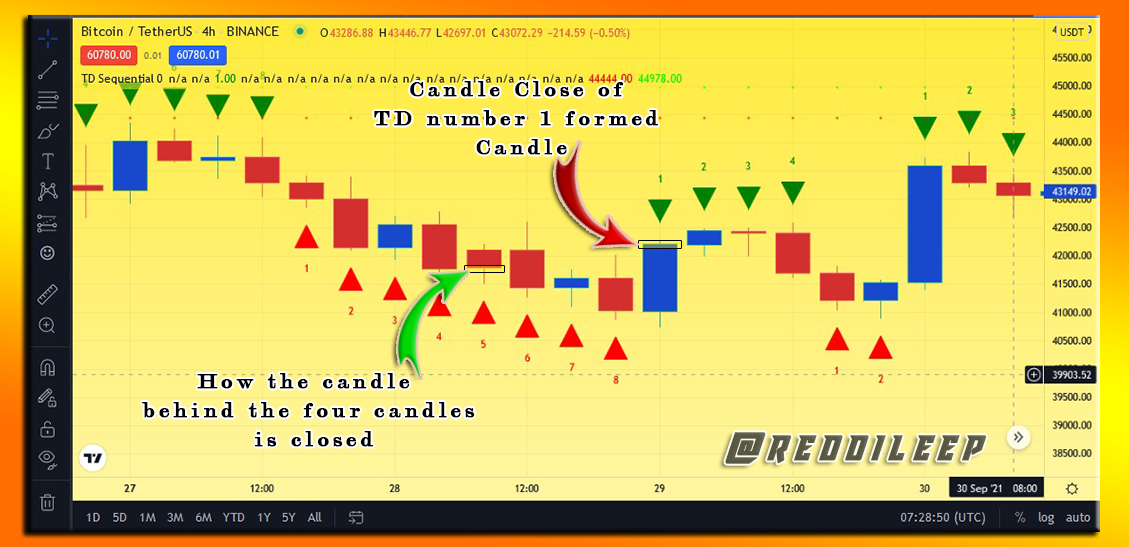
After that, if the close of any candle is above the close of the candle after four candles have gone backwards from that candle, number one will start showing above that candle. I will show an example to illustrate this.
Screenshot was taken from https://tradingview.com
The same thing happens with numbers 2 to 9. So if four candles go backwards from each of those candles, we can clearly see that its close is below the candle that contains that number. This is how numbers are created in a sell setup.
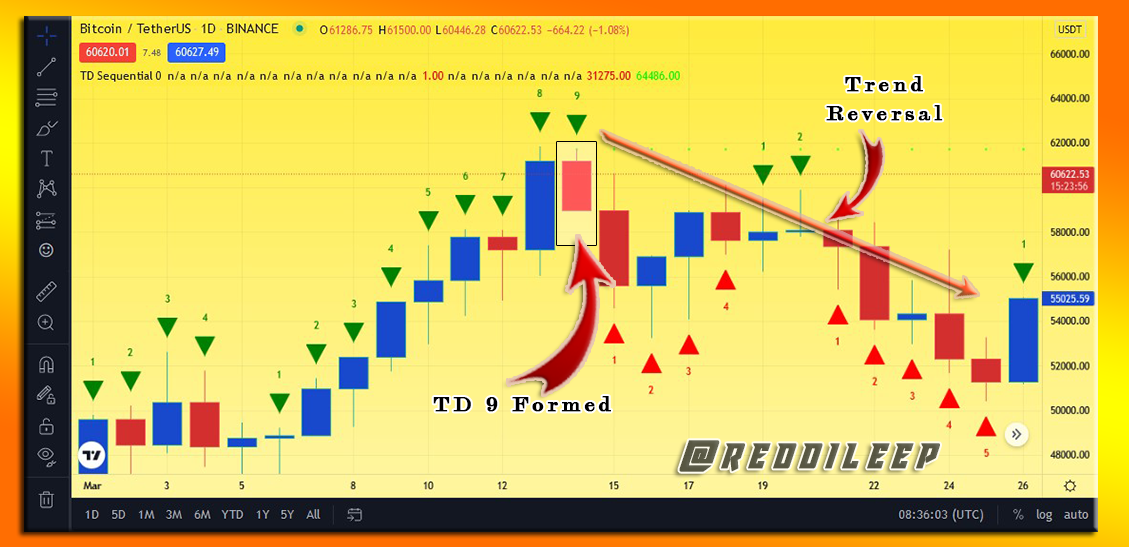
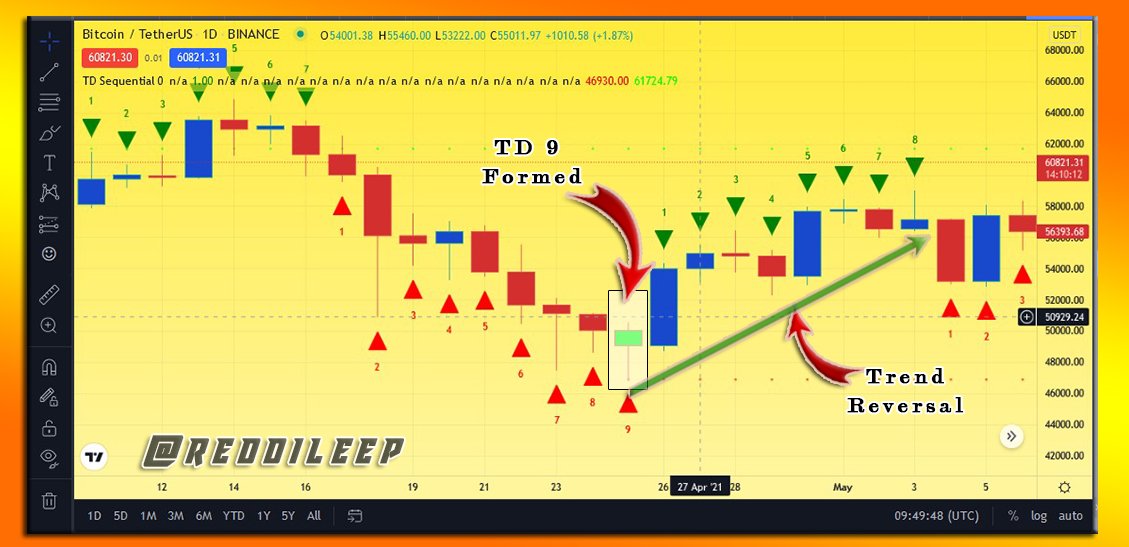
When eight or nine candles go that way, we can say that the market is over-extended. This means that the market has moved in one direction more than it needs to. So most of the time there is a chance of a correction or a reversal in such cases. There may be at least a consolidation in the market in such cases. In fact, after eight or nine numbers are formed, we say that a sell setup is completed. I will illustrate such instances with examples.
Screenshot was taken from https://tradingview.com
Furthermore, sometimes we can see that these numbers have interrupted in some places without reaching up to 8 or 9. The reason for this case is that if the close of any candle is below the close of the candle after four candles have gone backwards from that candle, it can be said that the sell setup is interrupted. Then a new sell setup or buy setup starts all over again.

Basically what happens here is the other side of the sell setup. That is a sell setup is formed when the market goes downward. Then, if the close of any candle is below the close of the candle after four candles have gone backwards from that candle, number one will start showing below that candle. So, same like previously, after eight or nine numbers are formed, we say that a buy setup is completed. After that, a correction or reversal of a trend may occur. It means that the current downtrend can be converted into an uptrend or can be consolidated. I will illustrate such instances with examples.
Screenshot was taken from https://tradingview.com

TD Countdown is slightly different when we compare it to the TD Setup. Actually, here we have to consider 13 counts instead of 9 counts. In fact, in today's lesson, I focus mostly on the TD setup and will explain the TD Countdown very briefly.
Here we consider the candle behind only two candles per relevant candle. It means If the close of any candle is above/below the close of the candle after two candles have gone backwards from that candle, number one will start showing above/below that candle. When the candle reaches 13 counts, it can be taken as a correction or reversal of the current trend. In fact, there is much more detail relevant to TD Countdown. But, the most commonly used is the TD Setup, so let's focus more on that.

As I described earlier, there are a few different modified variations for this TD Sequential Indicator. Here I use the most commonly used TD Sequential Indicator. First, let's see how to add TD Sequential Indicator to the chart,
Here I've used https://www.tradingview.com to demonstrate it.
First of all, we can search for TD Sequential Indicator from the Indicators and Strategies icon that we can find on the top tool panel. (Keep in mind that only the TD Setup is actually used in this TD Sequential Indicator)
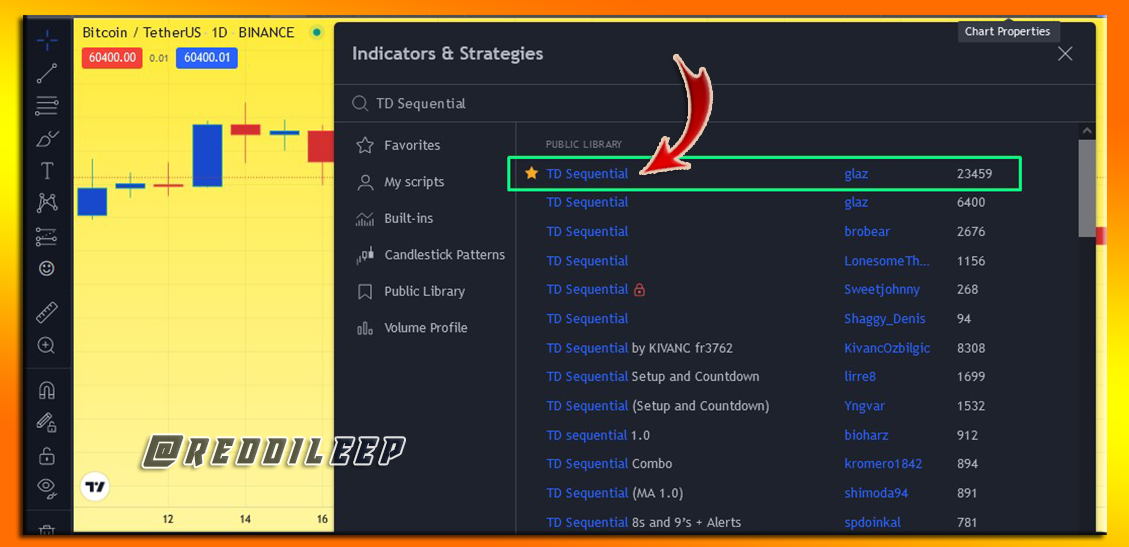
Screenshot was taken from https://tradingview.com
So the basic factors used here I have already explained in the "TD Sell setup" topic. However, I will briefly explain it here as well.
After the market has gone a significant downward trend or uptrend, that is, at least one Bearish or Bullish candle is formed in a higher time frame and then bullish or bearish candles begin to form. This should be the first thing that needs to happen. After that, if the close of any candle is above/below the close of the candle after four candles have gone backwards from that candle, number one will start showing above that candle.
When eight or nine candles go that way, we can say that the market is over-extended. This means that the market has moved in one direction more than it needs to. So most of the time there is a chance of a correction or a reversal in such cases. There may be at least a consolidation in the market in such cases. In fact, after eight or nine numbers are formed, we say that a sell setup or buy setup is completed. I've already shown some examples to illustrate it. (Check above "TD sell setup" and "TD buy setup" topics )
Now let me discuss how to use it for Successful Trading. In fact, in addition to the key factors mentioned above, there are other few factors to consider if you want to use this for Successful Trading.
The main thing is that we should use this indicator only at a higher time frame. It means we have to use at least 4h time frame. Actually, we can use it for below 4h time frames too. But, the predictions that we receive from the above 4h time frame will be more accurate.
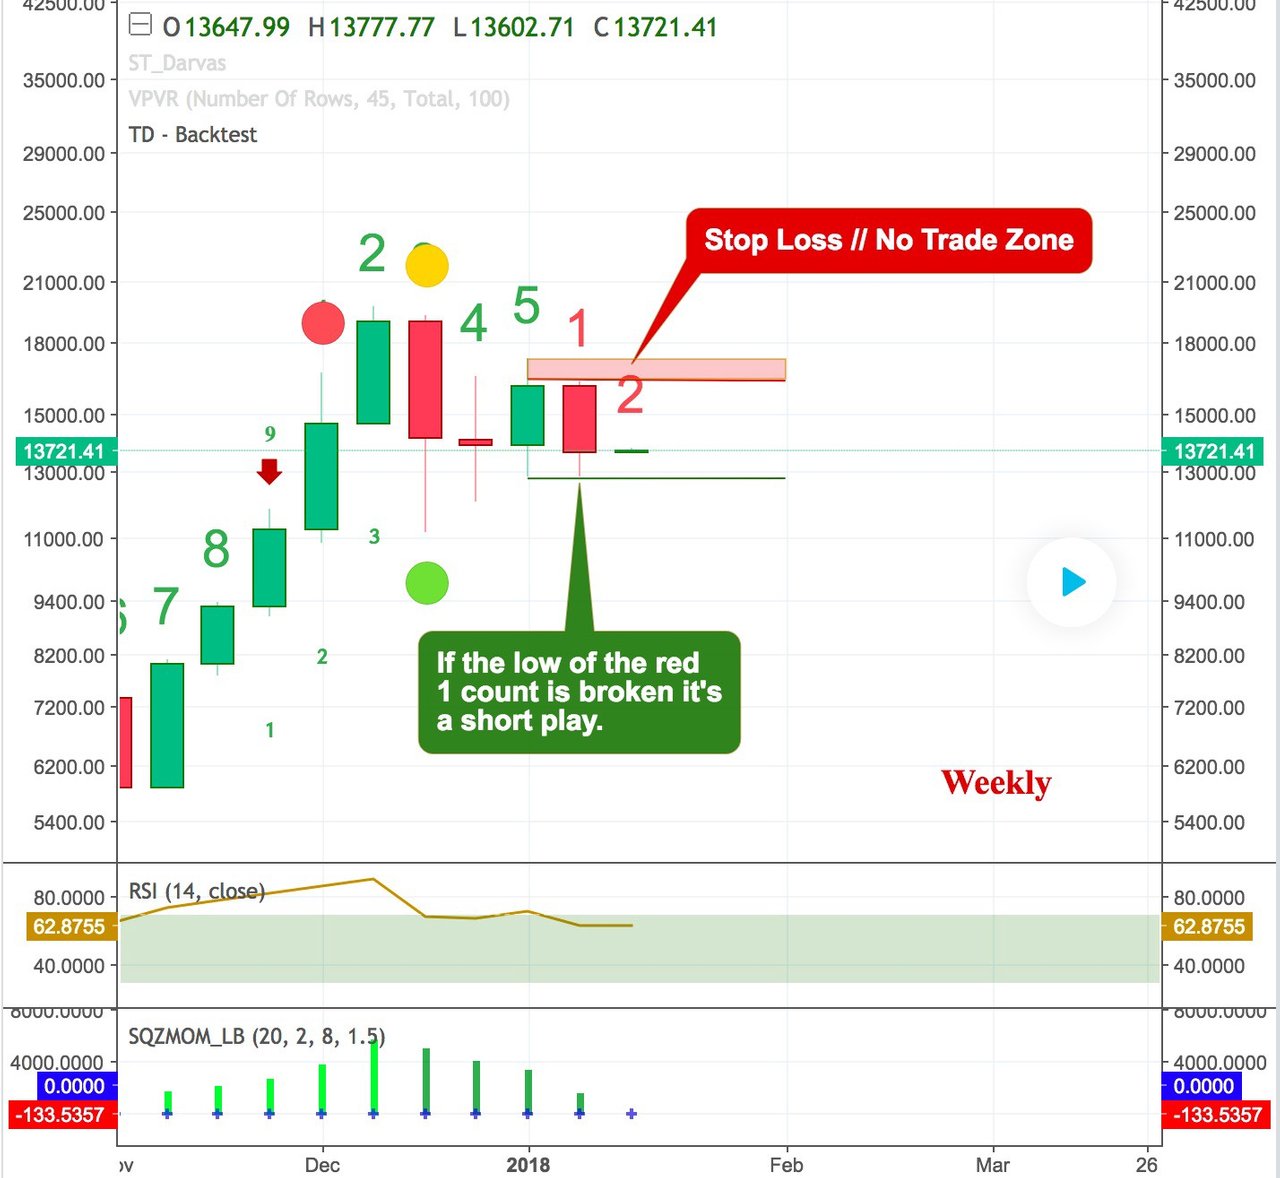
Secondly, we should try to more focus on candles that have perfect 8 or 9 counts. As an example, if a sell setup occurs with 8 and 9 counts, then the 9th candle high is above the 6 and 7thcandles, it can be defined as a perfect candle. Same like that if the 8th candle high is above the 6 and 7thcandles, it can also be defined as a perfect candle.
Here if the 9thcandle high is above the 8thcandle's high, it can be defined as more perfect. Such situations are automatically highlighted in this TD Sequential Indicator. (In a different colour candle) Below I've included an example to demonstrate it.
Screenshot was taken from https://tradingview.com
- After such instances, 1 to 4 candle correction may occur. Furthermore, if we take a time frame like weekly and monthly, 9 candles may not count in such cases. Probably it can be 5th, 6th or 7thcandle. Also, keep in mind that this indicator does not work when the market is very strong.
If we are able to identify all the above-mentioned cases using charts in any crypto coin, we have the possibility to get a higher winning rate. However, no indicator is 100% successful and care must be taken not to rely on one indicator alone.

In my lesson, I have described only a summary of these topics and you should do better research and answer all the following questions in your own words. You are totally free to use any language. But when you mention something in the screenshots, you must use only English.
1- Define TD Sequential Indicator in your own words.
2- Explain the Psychology behind TD Sequential. (Screenshots required)
3- Explain the TD Setup during a bullish and a bearish market. (Screenshots required)
4- Graphically explain how to identify a trend reversal using TD Sequential Indicator in a chart. (Screenshots required)
5- Using the knowledge gained from previous lessons, do a better Technical Analysis combining TD Sequential Indicator and make a real purchase of a coin at a point in which TD 9 or 8 count occurs. Then sell it before the next resistance line. (You should demonstrate all the relevant details including entry point, exit point, resistance lines, support lines or any other trading pattern such as Double bottom, Falling wedge and Inverse Head and Shoulders patterns.)

You must submit your Homework Posts in the Steemit Crypto Academy community.
You have to include all the details in your own words without including someone's words in your content. The concept can be the same but your content should be unique.
You must include at least 800 words in your homework posts.
Plagiarism is strictly prohibited in the whole Steemit platform and you will not receive any privileges.
All the screenshots and images should be fully referenced and the referenced images should be copyright-free. And also, include your user name as a watermark in every screenshot.
You should use tags #reddileep-s4week8 #cryptoacademy and your country tag among the first five tags. Furthermore, you can include relevant tags such as #td-sequential , #td-setup, #cryptotrading. Additionally, you can add the #club5050 tag among the first five tags if you have done powers ups equivalent or greater than as compared to your cashouts.
Your homework Title should be
[How to Trade Cryptocurrencies Profitably Using TD Sequential]-Steemit Crypto Academy | S4W8 | Homework Post for @reddileepHomework task will run from Sunday 00:00 October 24th to Saturday 11:59 pm October 30th UTC Time.
If you have a reputation of 60 or above, and a minimum SP of 400, then you are eligible to partake in this Task. (You must not be powering it down and your effective SP should not be delegated-in SP). And also, if you have used any buying vote services to build your reputation, you will not be eligible to partake in this Task.
If you didn't receive the score for your homework post within 48 hours, you can put the link in the comment section. Otherwise, don't leave your post link here.
If you have any queries related to my lesson, you are totally free to ask anything in the comment section.
Cc:
Comments