Topdown Analysis Of DYDXUSDT Using Support And Resistance Strategy And RSI Indicator As A Confluence
2 comments
Hello great minds,
I feel excited to come before you all this evening to relate with you on another interesting post in the community.
I trust you are all doing perfectly fine and are enjoying your activities in the community as you actively promote steemit across various social media platform.
Today I will be sharing my analysis on dydxusdt just as I used to in the community, please stay tuned.
ANALYSIS USING SUPPORT AND RESISTANCE STRATEGY
Dydx is a good token in the cryptospace which is one reason I have chosen it for my analysis today.
And I will be sharing the latest price movement as at when this post was made.
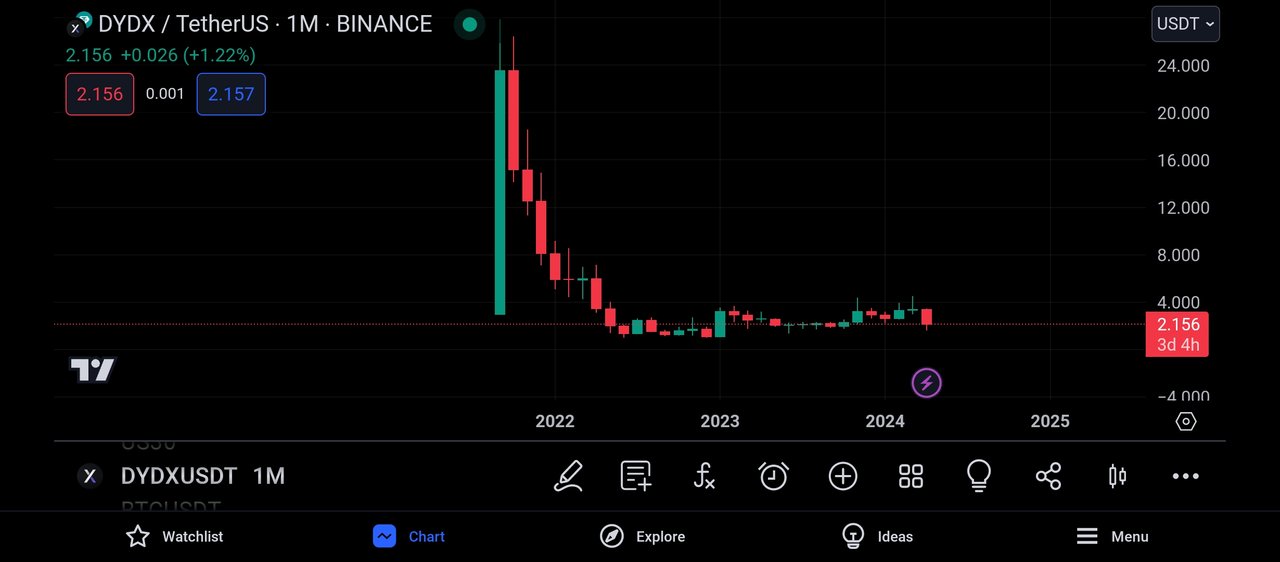
I decided to begin my analysis on the monthly timeframe just as seen above.
And on this timeframe, we can see that there are less candles on the price chart, which indicates the presence of buyers and sellers in the market.
And also, the monthly timeframe helps to filter out noise from the market as each candle is formed within the time period of 1month.
Also on this timeframe, it is very easy for the market overall trend to be detected, and from the screenshot above, we can see that the market is being bearish overall.
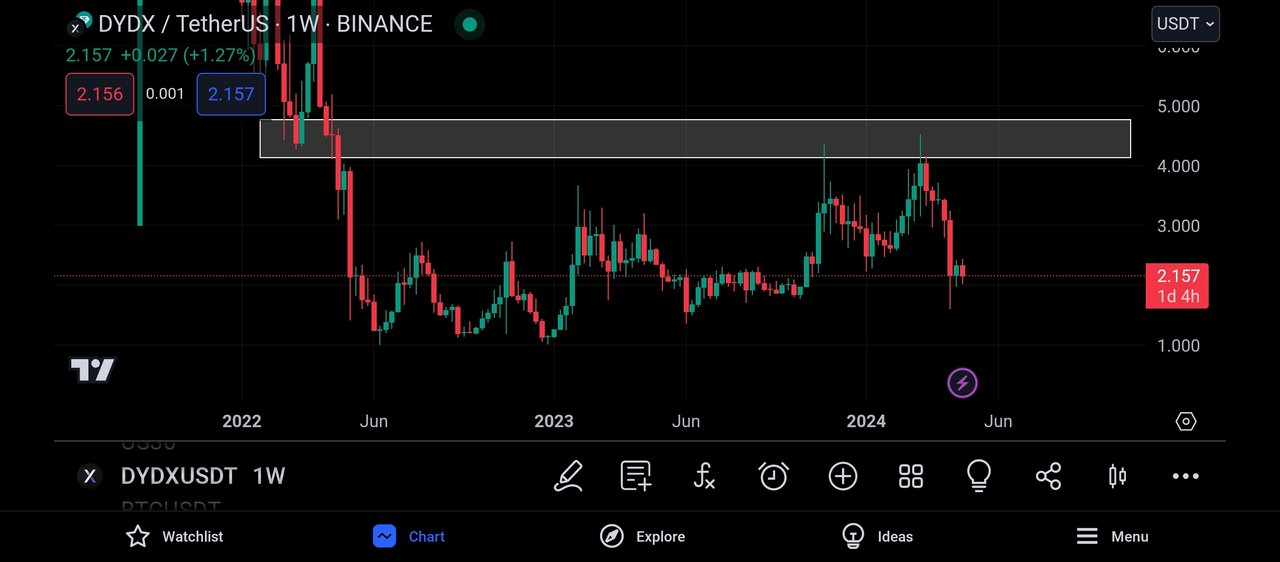
Then I decided to continue to the weekly timeframe for more market analysis.
On this timeframe, I saw more market candles and this is because each candle was formed during the period of week.
Then I was able to spot a key level on this timeframe,and this level is functioning as a resistance level to the market price.
It is a valid level as it has been respected by market price, and it is expected for it to be respected again when the market gets to it.
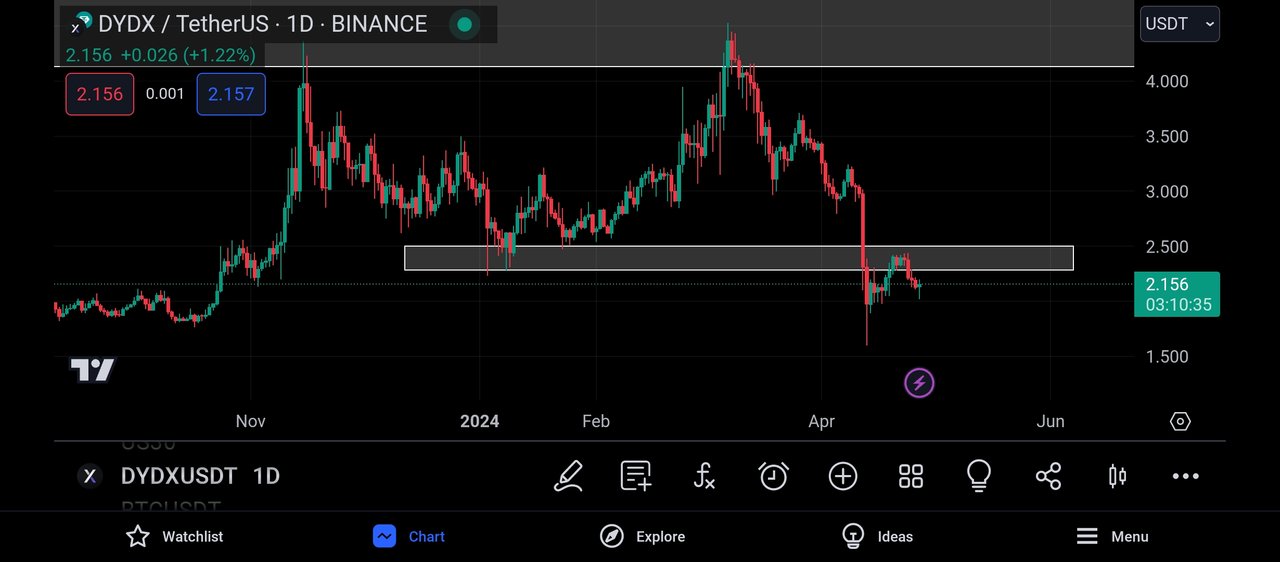
Moving to the daily timeframe, I could see more market candles.
I could see the struggle between buyers and sellers as they strive to pull price to their preferred direction.
Also on this timeframe, u spotted another key level, which is functioning as a resistance level to the price chart.
It previously functioned as a support level untill it was broken, and now It is functioning as a resistance level.
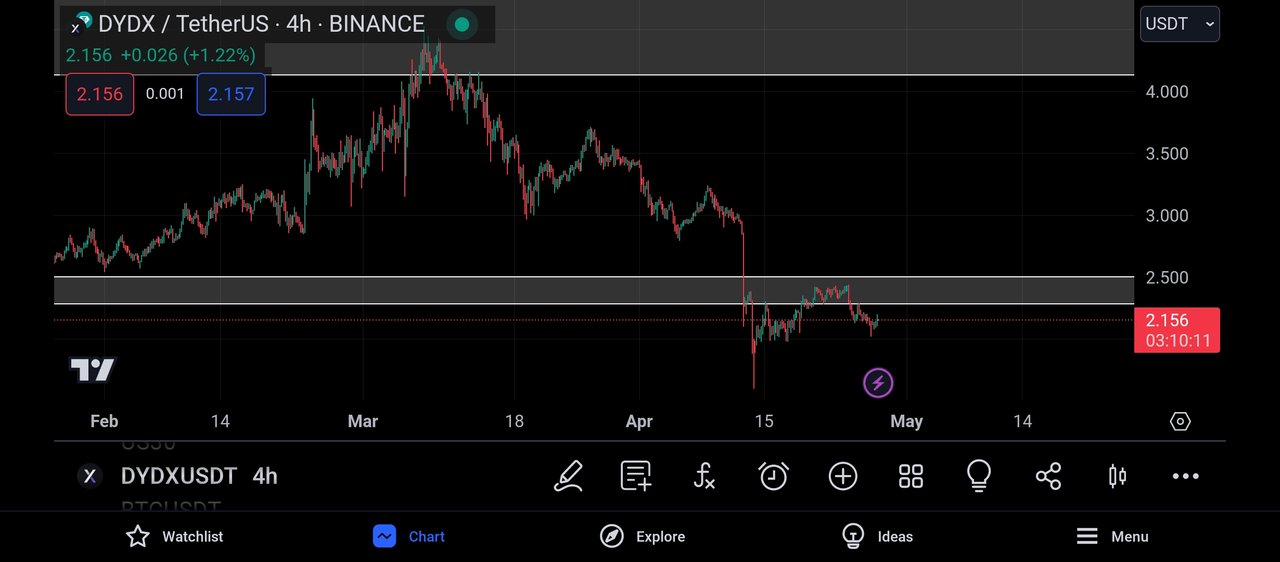
Moving to the 4hr timeframe, I could see the market very clearly, I saw several candles which indicates how noisy the market it
And here, I noticed that the market has broken this support level and has retraced to retest this broken level.
Upon the retracement, I could also see that there have been formation of rejection candles, just as expected, and it is on this rejection that I intend to take my entry into the market.
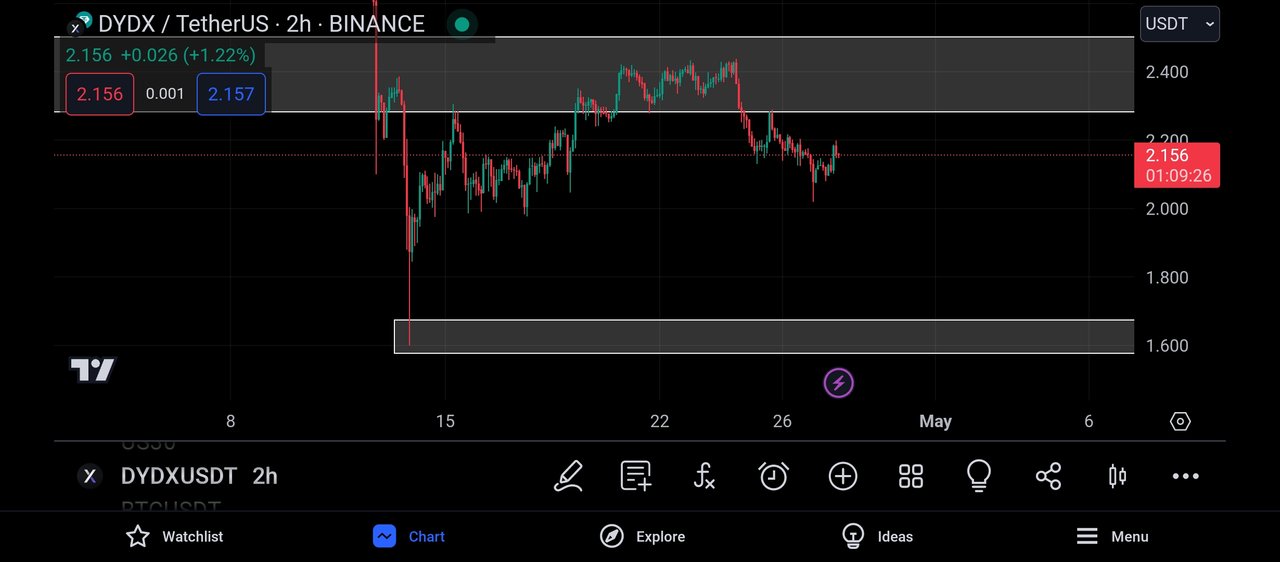
And when I moved to the 2hr timeframe, I noticed the formation of bullish candles, and this is an indication that the market is about to retest this broken level again before it continues its downward move.
And then I decided to search for confluence using the rsi indicator.
CONFLUENCE USING RELATIVE STRENGTH INDEX INDICATOR
The rsi Indicator is a very important trading tool in the cryptomarket.
The rsi indicator is used to spot oversold and overbought market regions.
And when a market is spotted to be oversold, it is a signal that the market is about to experience a bullish move.
And when a market is spotted to be overbought, it is a signal that the market is about to experience a bearish move.
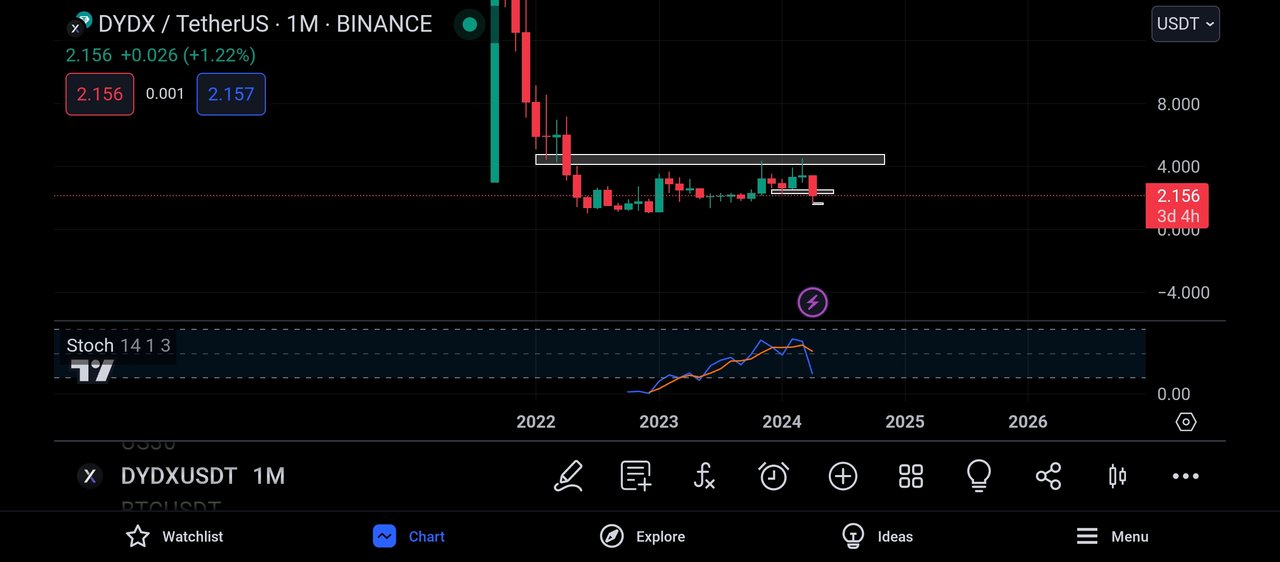
Applying the rsi to the monthly timeframe, I noticed that the rsi has gone below its 20% line, and this is an indication that the market is being oversold.
An oversold market signals a bulllish trend reversal, as the market needs to be bought for balance to be maintained.
Then I decided to continue my analysis on the daily timeframe.
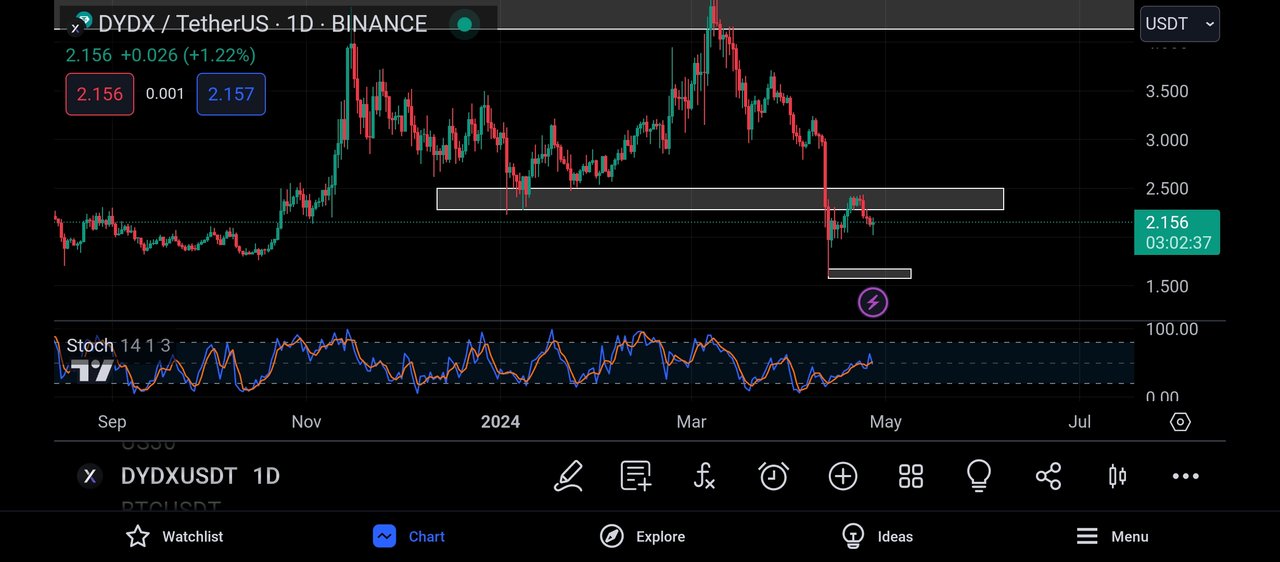
On the daily timeframe, I noticed that the rsi is approaching its 80% line, and this is an indication that the market is being overbought and needs to be sold.
An overbought market region often signals a bearish trend reversal, that is the market is expected to embark on a bearish move.
And this is in alliance with my analysis using the support and resistance strategy.
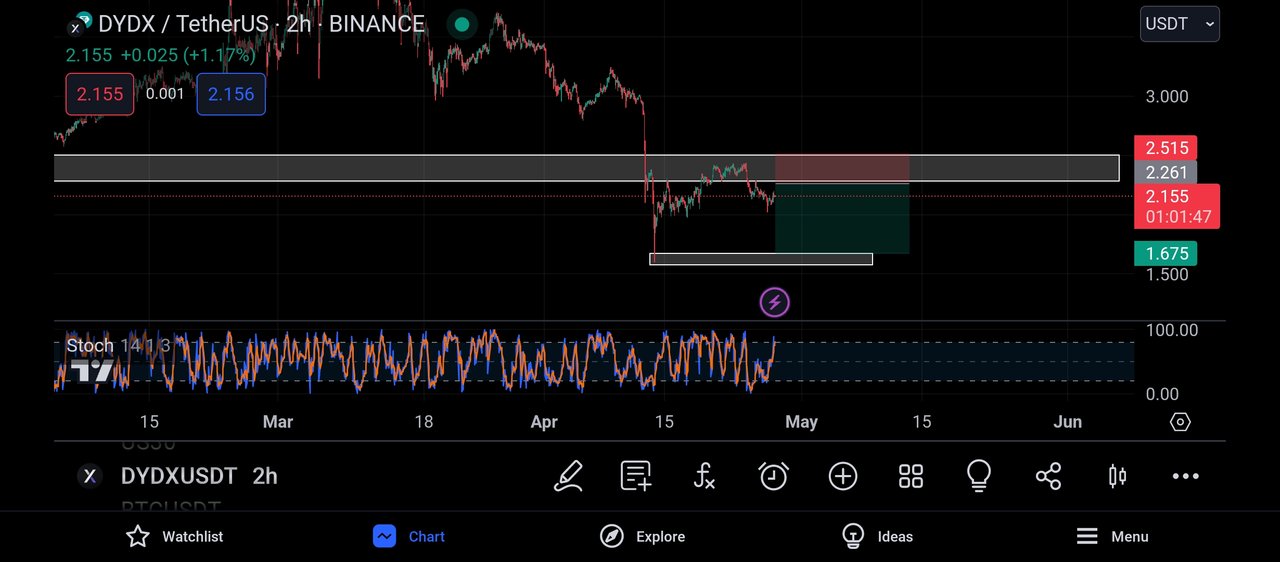
After establishing my bias, I moved to the 2hr timeframe where I intend to take my entry from.
I then decided to enter the market from the resistance level closest to the market, and my take profit was placed on the support level closest to the market.
As this can be confirmed above.
CONCLUSION
Dydx is actually a very good token but before investing in it, I'll advise that you make your personal research about it.
My post was made for educational purpose and not as a financial advice.
Comments