Topdown Analysis Of SOLUSDT Using Support And Resistance Strategy And RSI Indicator As A Confluence
2 comments
Hello great minds,
It is a wonderful opportunity to come before you all today to discuss on an issue of great importance in the cryptospace.
I believe you are doing perfectly fine and are enjoying your activities in the community as you actively promote steemit across various social media platform.
Today, I will be sharing my analysis on solusdt, and Solana is a popular token in the cryptospace.
Solana is a very popular project in the cryptospace and has brilliant team who are diligent and have great fundamentals, and as such, I will be sharing my analysis.
Please stay tuned and check out my analysis on this great token.
ANALYSIS USING SUPPORT AND RESISTANCE STRATEGY
My analysis of the cryptomarket often begins from the higher timeframe to the lower timeframe, but I prefer beginning mine from the monthly timeframe.
The monthly timeframe helps me a lot in filtering out noise from the market, and alongside that, it also plays a huge role in the identification of market trends.
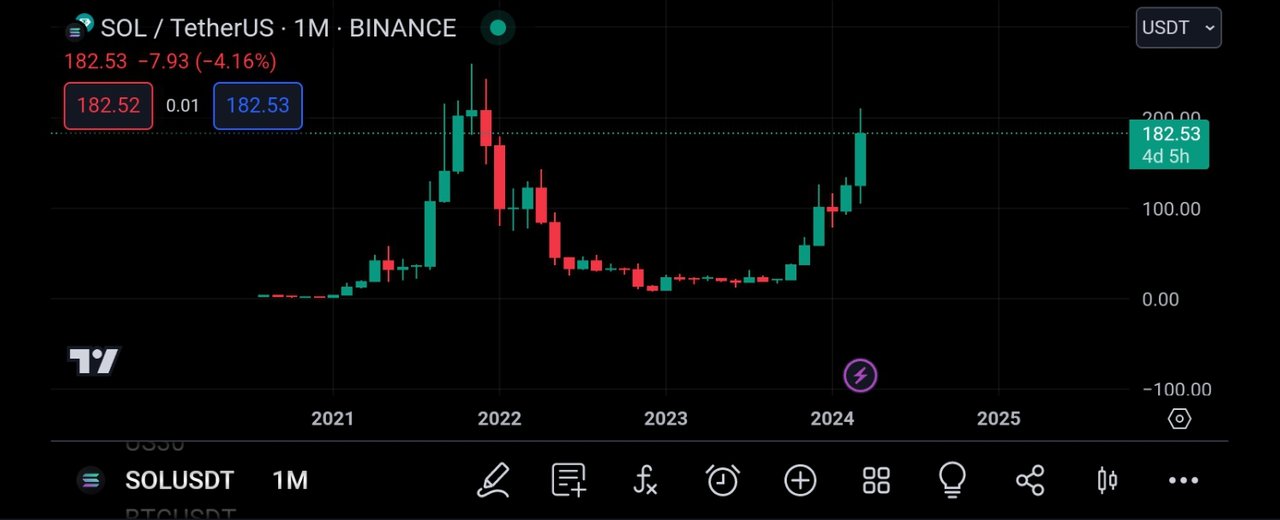
The above screenshot is that of solusdt on the monthly timeframe, and as seen above, there are few candles on this timeframe.
On this timeframe, it is easier for the market trend to be detected, as there are also less market noise.
We can say that the pair solusdt is recovering from a bearish trend and has been bullish for some months now.
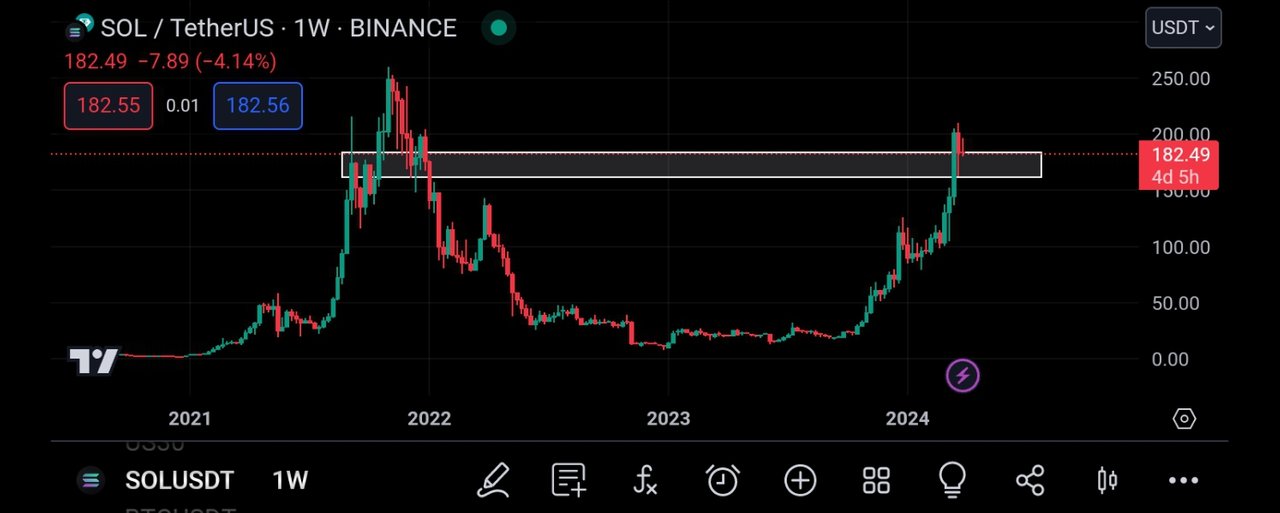
I then opened on the weekly timeframe for more market analysis, and on this timeframe, I could see more candlestick than on the monthly timeframe.
On the weekly timeframe, I was able to spot a valid market level, which has previously been respected by market price.
And it is expected that when the market gets to this level there will be a reaction on this level.
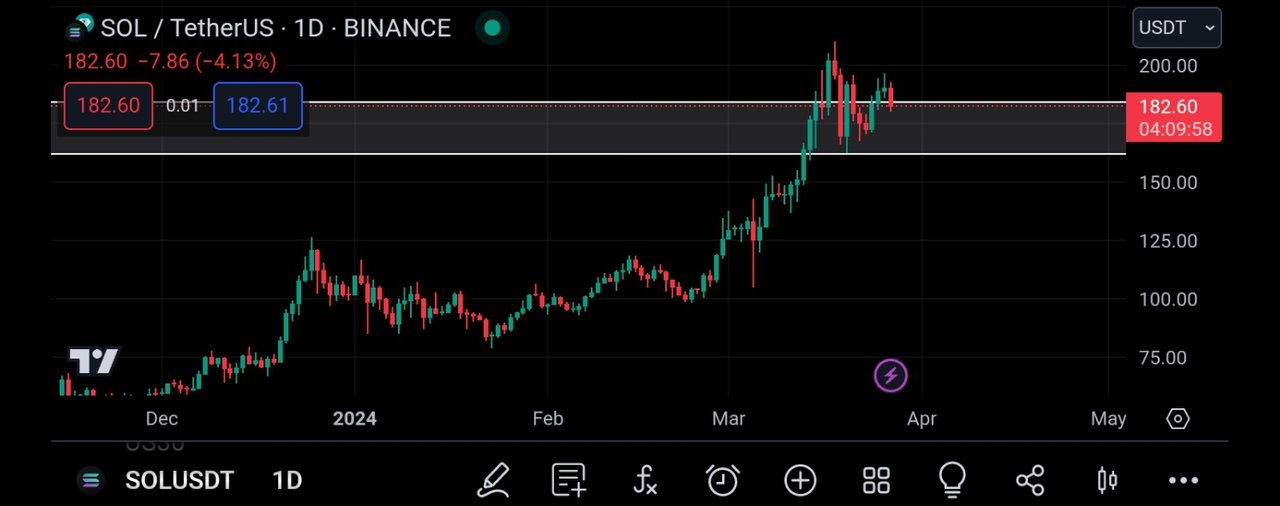
Moving to the daily timeframe for more market analysis and I discovered that there are more candlestick on this timeframe than on the weekly timeframe.
Then on this timeframe, I noticed that the market has broken above the resistance level, and it is expected that the market retraces to retest this broken level.
After retracing, we expect to see a bullish rejection, and then we can join the market, or the breakout can be a false breakout.
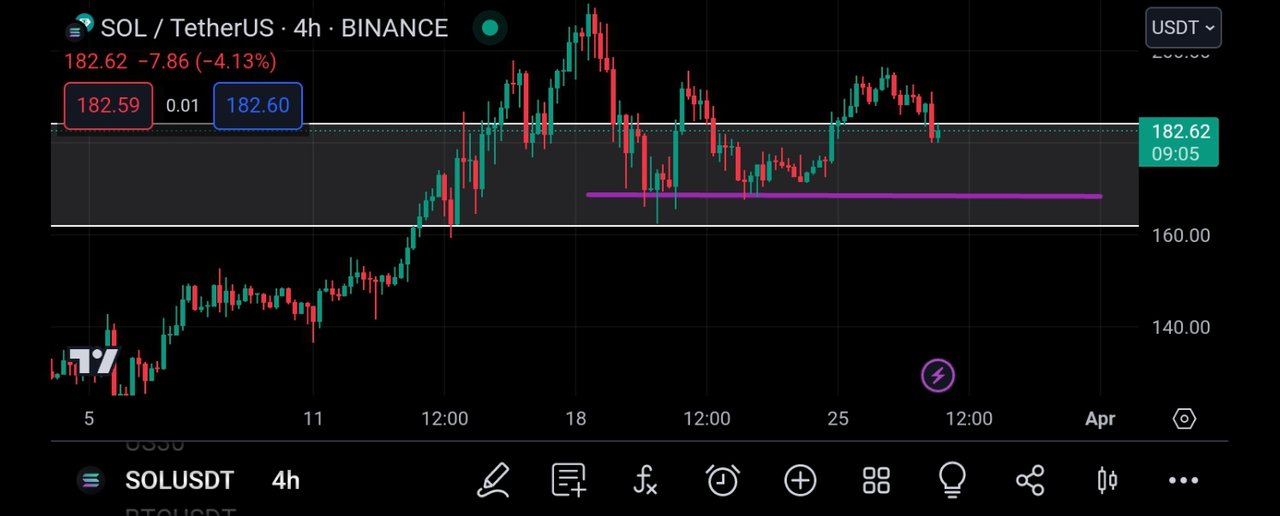
On the 4hr timeframe, I could see the market more clearly, I can see the buyers and sellers struggling to drive price to their preferred direction.
And also, I noticed that the market has retested this broken region the first time and it is on its way to retest this region again.
Upon the sight of a bullish rejection candle, then I can proceed into entering the trade.
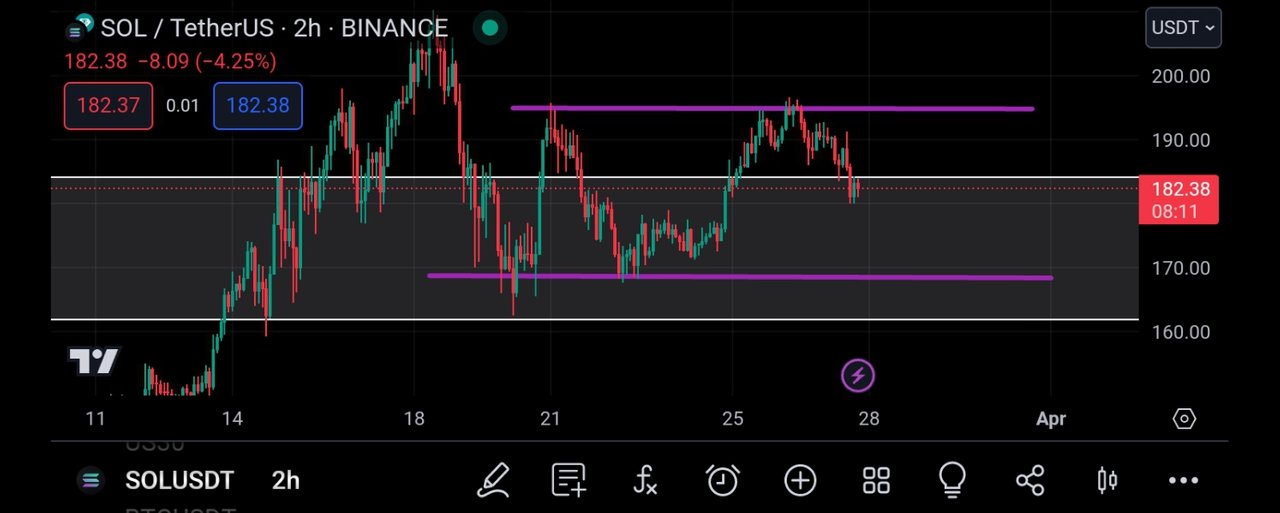
On the 2hr timeframe, I saw the market price driving downward to retest the broken resistance level.
I can thus decide to enjoy the ride downward or wait for an upward rejection, and all of this will be dependent on the signal from the rsi indicator.
CONFLUENCE USING RELATIVE STRENGTH INDEX INDICATOR
The rsi indicator is a technical tool that is used to detect overbought and oversold market.
When the rsi oscillator crosses above the 80% line, the market is said to be overbought and this is known to be a bearish trend reversal signal.
And when the rsi oscilator crosses below the 20% level, the market is said to be oversold.
An oversold market signifies a bullish trend reversal signal, that is , the market is expected to move in the upside direction.
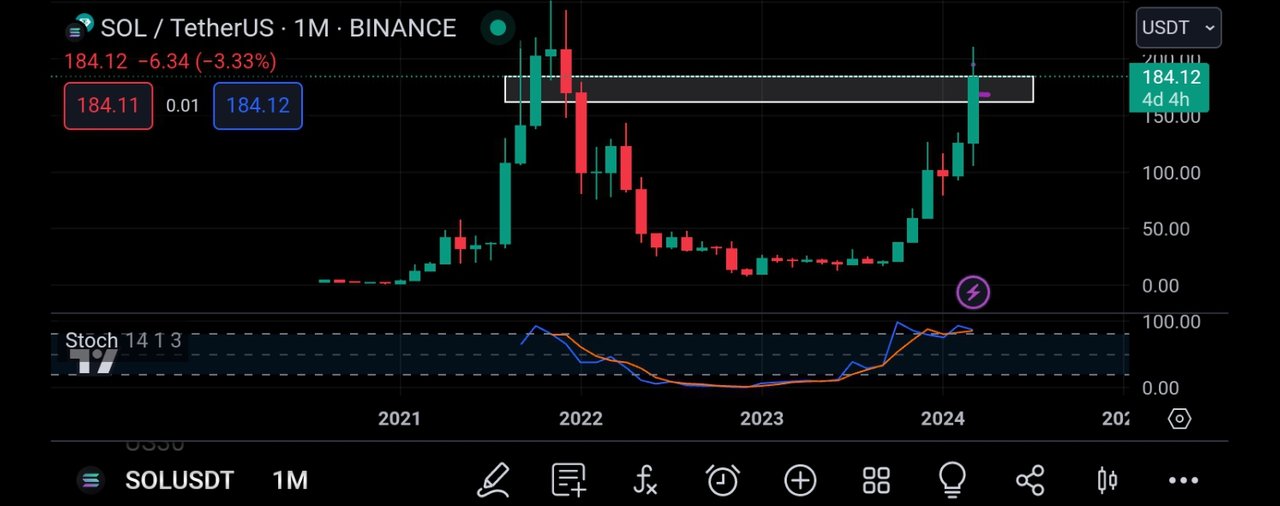
I immediately applied it to the monthly timeframe and from the above screenshot, we can see that the rsi has crossed above the 80% line.
And this is seen to be a bearish trend reversal signal, that is the market is being overbought and need to be sold.
Then I moved to the weekly timeframe for more analysis
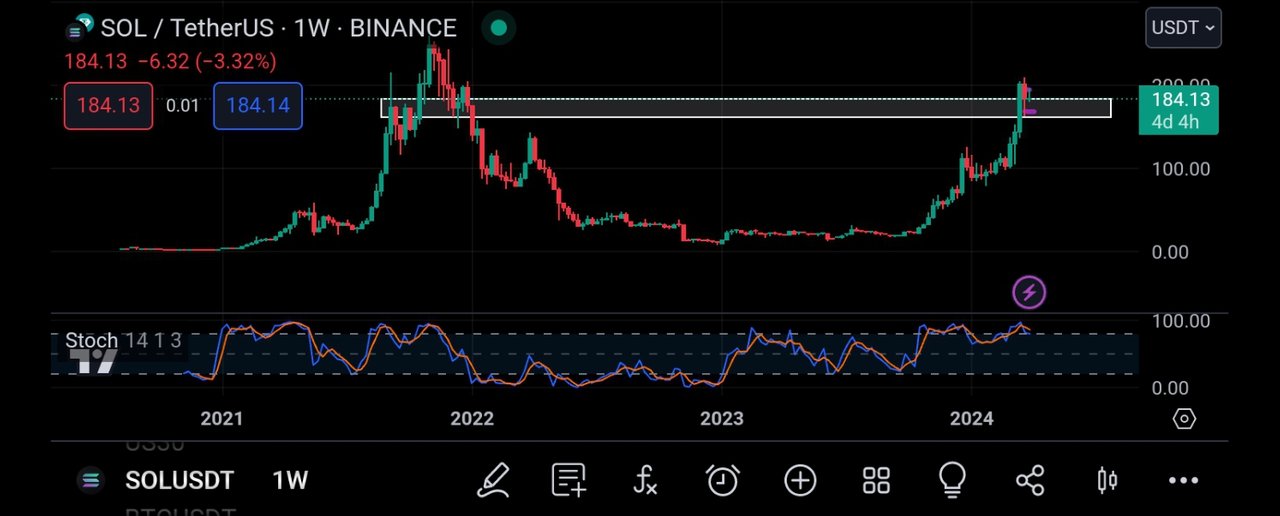
On the weekly timeframe also, I noticed that the market is being overbought as the rsi has crossed above the 80% line.
This is also a signal that the market is about to experience a bearish trend reversal.
And with this, I moved to the 2hr timeframe for confluence to my trade.
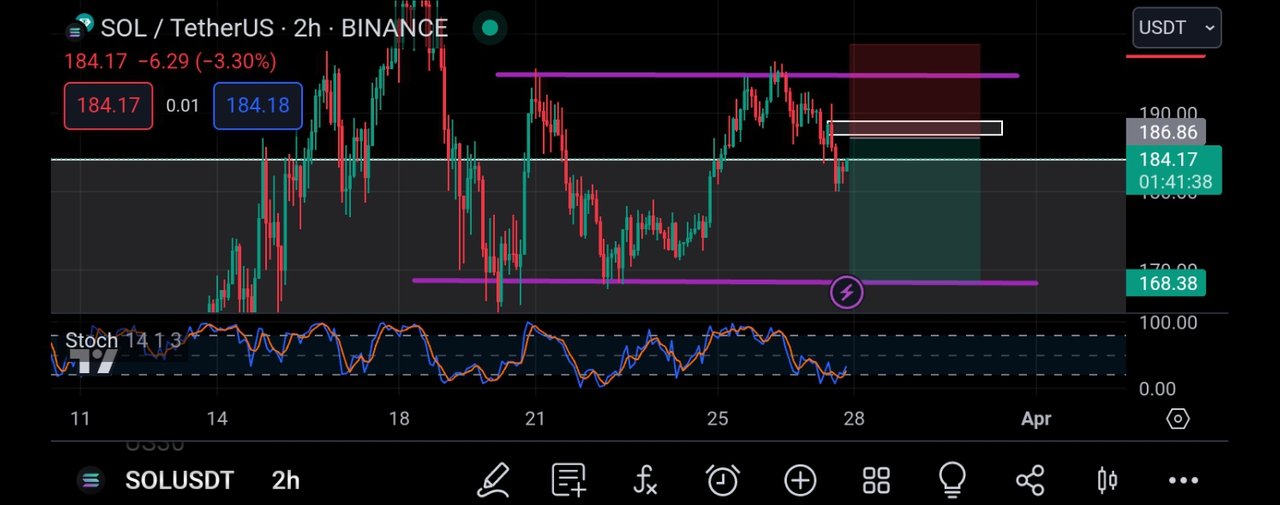
On the 2hr timeframe, I was able to spot a valid level which can be used as a entry to join the market for its short term sell.
And I placed my take profit on the closest support level just as seen above.
CONCLUSION
Solana is a very good project in the cryptospace but I encourage all to make their own research before investing in any token.
My post should not be taken as a financial advise rather as an educational content.
Comments