Topdown Analysis Of AVAXUSDT Using Support And Resistance Strategy And RSI Indicator As Confluence
2 comments
Hello great minds,
I feel honored to approach you all today to discuss on a very important issue in the cryptospace.
I believe you are all doing perfectly fine and are enjoying your activities in the community as you actively promote steemit across various social media platform.
Today I will be sharing my analysis on the token of avalanche network which is avax, and I will be sharing my analysis on avax against usdt.
Please stay tuned as I share my analysis
ANALYSIS USING SUPPORT AND RESISTANCE STRATEGY
Technical analysis are best started from the higher timeframe and then to the lower timeframe.
Some analyst prefer starting their analysis from the daily timeframe, down to the fewer minutes, but I begin mine from the monthly timeframe.
The monthly timeframe helps me to compress market activities and display them on a screen.
And the monthly timeframe also helps in eliminating unnecessary noise from the market.
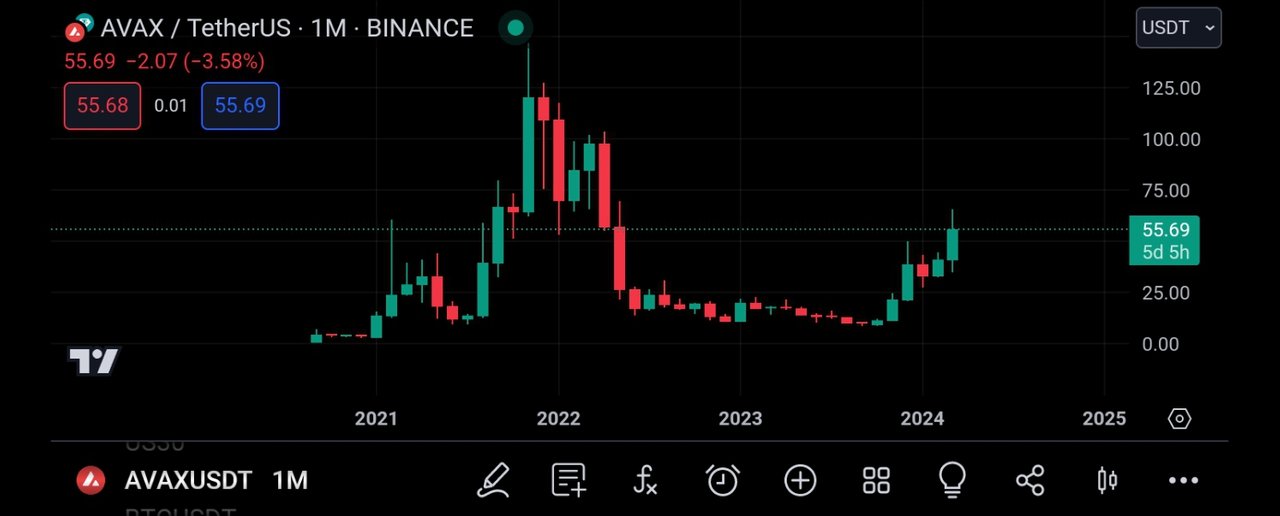
The screenshot above was gotten from trading view app and it is that of AVAXUSDT on a monthly timeframe.
And from the screenshot above, we can see that there are no noise in the market, and also we can easily detect the overall trend of the market.
From the above screenshot, we can see that the market latest leg is being bullish, consisting of higher highs and higher lows.
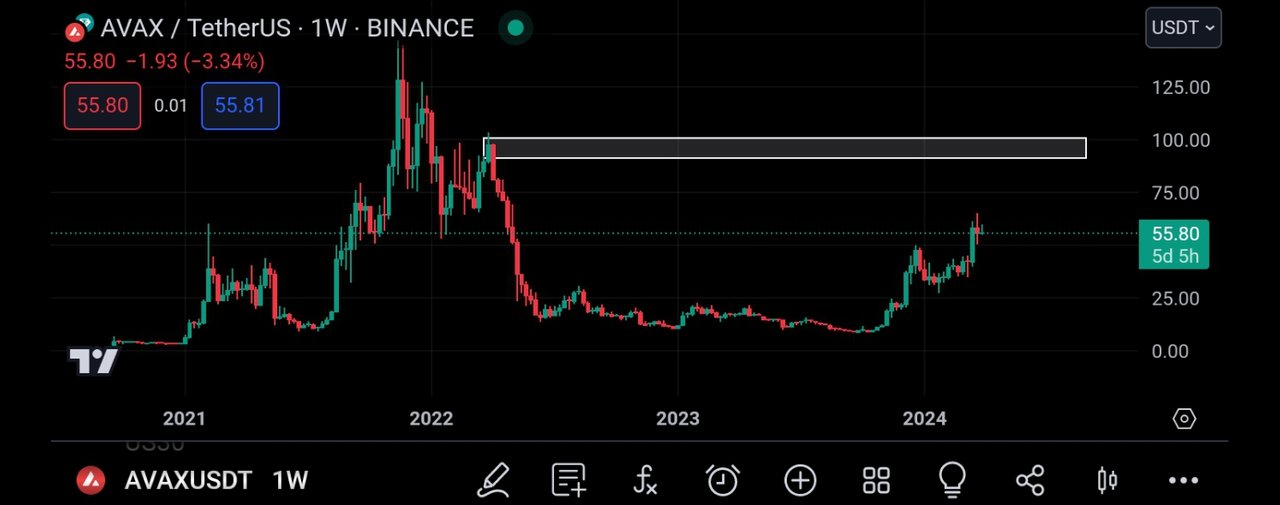
Moving to the weekly timeframe to continue my analysis, I could see more market candles.
And also I could see the buyers and sellers trying to drive price to their preferred direction.
Seeing this, I looked carefully and was able to spot a key resistance level, which has previously held market price.
And it is expected that when the market gets to this level, it will be respected again or broken.
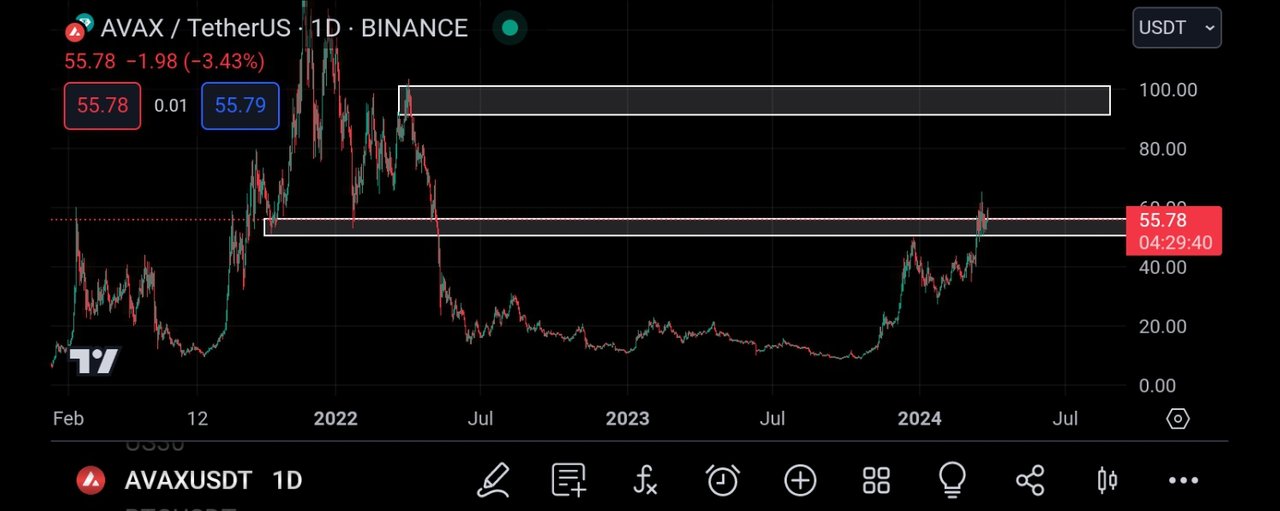
Moving to the daily timeframe, I could see more market activities than in the higher timeframes.
On this timeframe, I was able to spot another key level in the market.
This level formerly acted as a resistance level to market price but it has been recently broken and is now acting as a support level.
It is expected for the market to retrace to retest this broken level before continuing in it's bullish direction.
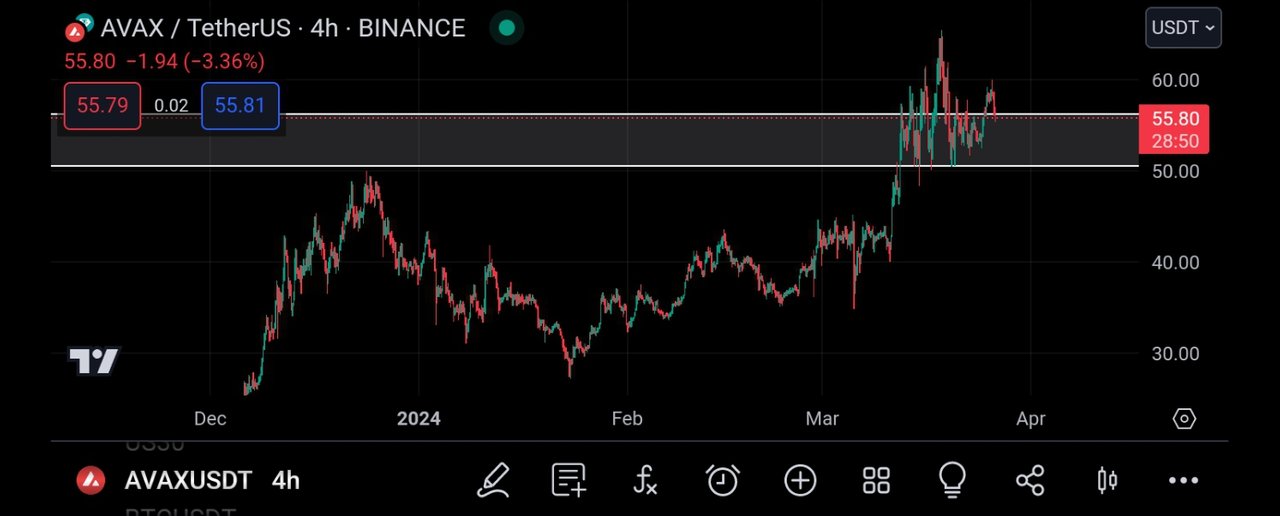
Moving to the 4hr timeframe for more analysis, I could see the market more clearly.
On this timeframe, I could see that the market broke the resistance level and has returned to retest it, and this is as I expected.
Then I will be on the lookout for a bullish rejection candle so I can join the market to the bullish side.
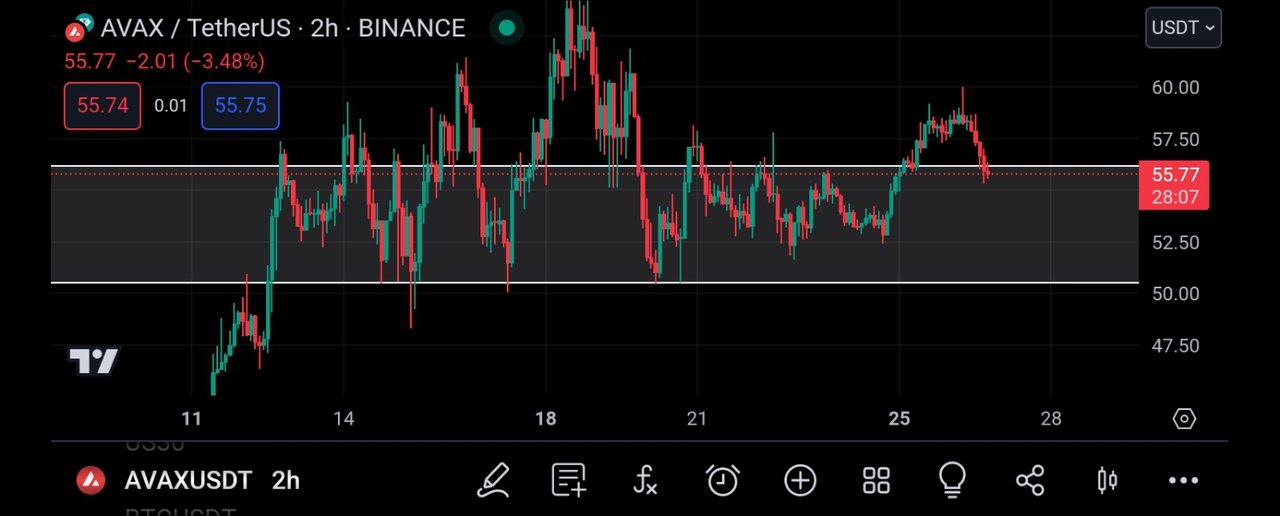
Moving to the 2hr timeframe, I saw the market movement clearly.
And from the this timeframe, I saw how the price retested this broken level.
From this, I am in search of an entry that will take me bullish on market price but before then, I decided to search for a trading confluence using my rsi indicator.
CONFLUENCE USING RELATIVE STRENGTH INDEX INDICATOR
The operation of the rsi indicator is no news to us in the community.
The rsi Indicator is used to detect overbought and oversold market regions.
And when an overbought market is detected, it is a bearish trend reversal signal, and when an oversold market is detected, it can be interpreted as a bullish trend reversal signal.
With this understanding, I will be introducing the charts
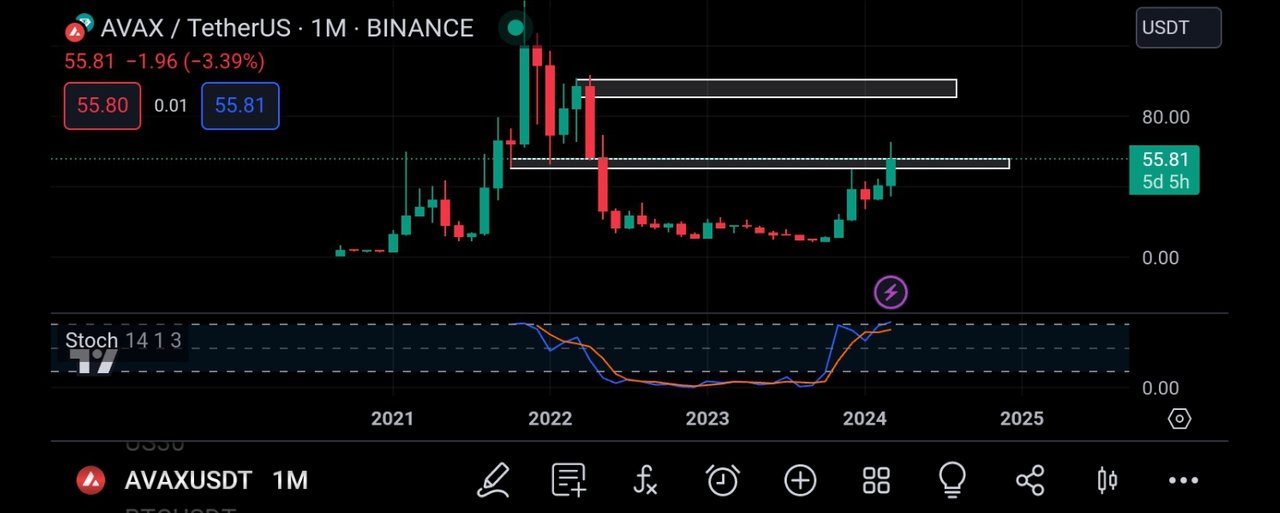
I then began from the monthly timeframe, and as seen above, the rsi has crossed above it's 80% line.
And this is a signal that the market is being overbought, thus signaling a bearish trend reversal move.
That is, we expect to see a bearish retracement of the market from the monthly perspective.
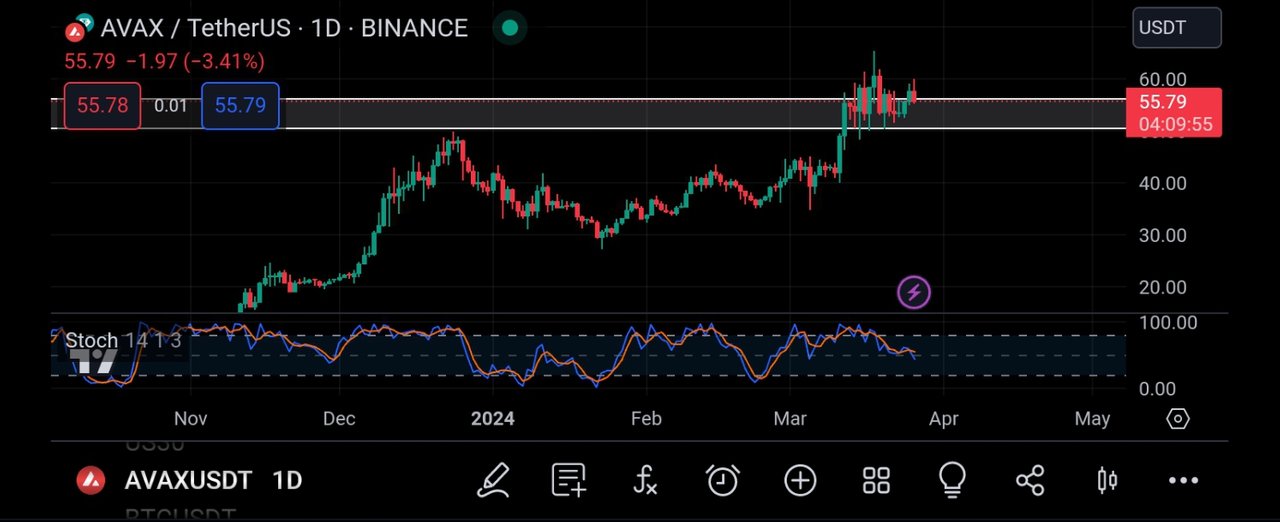
Moving to the daily timeframe, I also noticed that the market is being overbought as the rsi has crossed above the 80% line.
And this is serving as a bearish trend reversal signal, that is, the market is expected to be bearish.
With my bullish perspective, I visited the 2hr timeframe, in search of my entry.
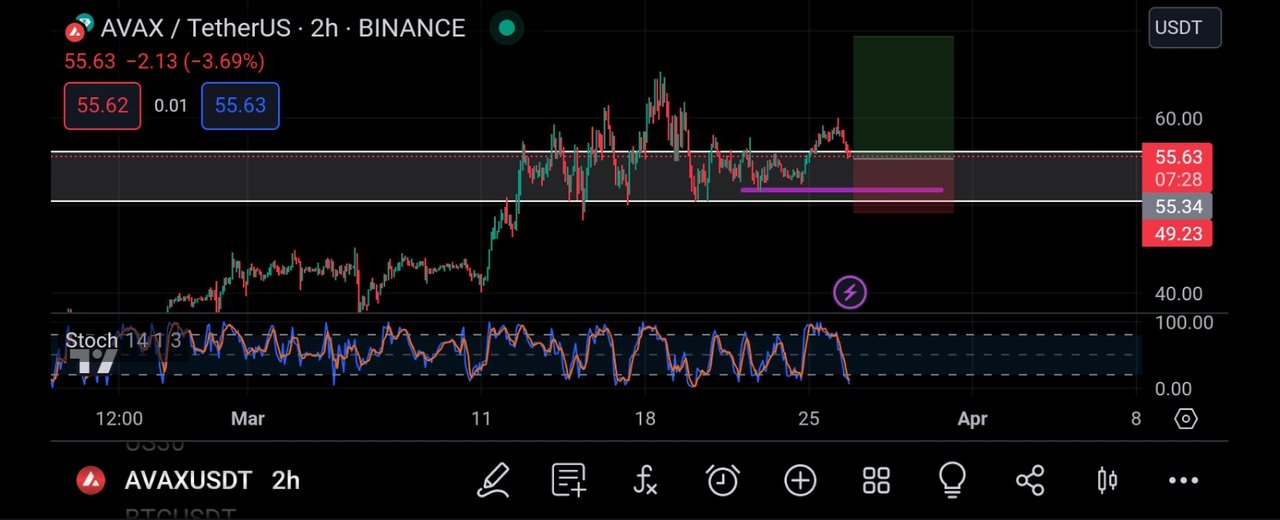
I then moved to the 2hr timeframe, and I noticed that the market is currently on a bearish move, retesting the broken level.
And as such, I entered the market from the broken resistance and I placed my take profit on the closest resistance level, which can be confirmed from the screenshot above.
CONCLUSION
Avalanche is a very nice crypto project in the cryptospace and its native token is what we know to be avax.
And as seen above, I have shared my analysis on AVAXUSDT, and I intend for my post to be taken as an educational content and not a financial advise.
Comments