[CONTEST] - SHARE LESSONSYOU KNOW - LEARN HOW TO USE SPARKLINES IN EXCEL
3 comments
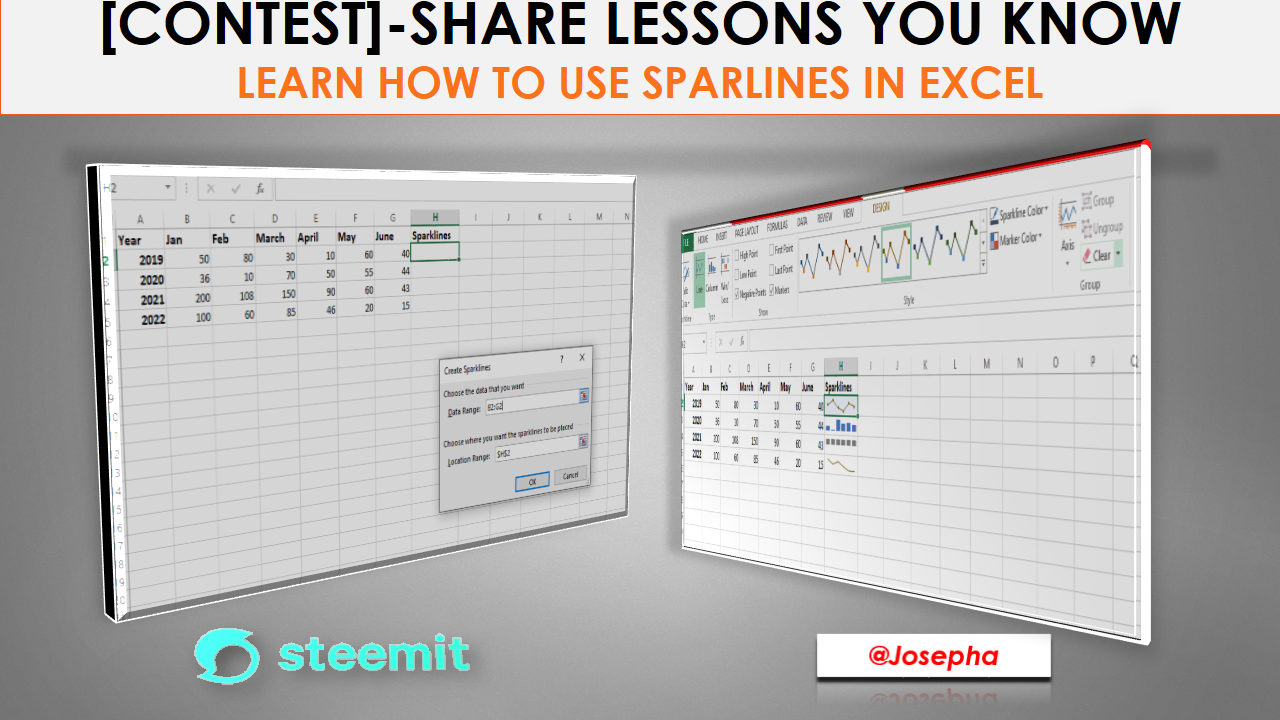
Hello friend, I am delighted to have you here. How are you doing today? In this tutorial, you will learn about Excel Sparklines as part of my entry to the contest that is organized by @klen.civil in STEEM FOR BETTERLIFE COMMUNITY. In order not to waste your time here, let's take a look at the content of this tutorial below.
What are Sparklines in Excel ?
My deer friend In Excel, a "sparkline" is a tiny graph that is used to show a collection of data. It does not fit into a full-fledged chart; it just occupies one cell.
The following three data visualizations are offered by Excel Sparkline: Lines, Columns, and Win/Loss. It's an immediate chart that is set up for a variety of values. In a nutshell, Excel Sparklines are used to display the data trend over time.
The purpose of Sparklines
With Sparklines' You can skip the tedious task of producing a large chart, which can be confusing during analysis, by employing a sparkline graph. In this case, when you wish to visualize a small subset of data from a huge dataset, this frequent visualization technique is utilized in dashboards.
Excel's sparklines aren't objects like Excel graphs; instead, they live in cells like regular data. Sparkline will automatically resize to fit inside the cells as you enlarge your Excel document.
Types of Excel Sparklines
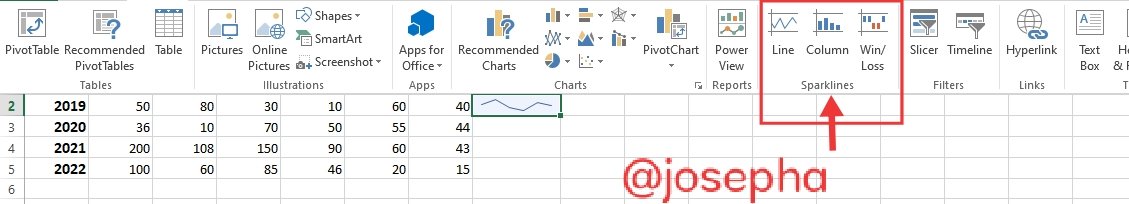
As earlier said, there are three types of Excel sparkles that you can choose from the insert menu of your Excel work. Line Sparklines Column Sparklines, and Win/Loss Sparklines.

From the screenshot above, you can all see that data is shown differently based on its type. Whereas the column is a scaled-down version of the bar chart, the win/loss resembles waterfall charts, and the line is a miniature version of the line chart.
How to add (insert) Sparklines in your Excel work
In order to insert Sparklines in Excel, you must first choose a specific column of data.
In this tutorial, let's consider using the data below. For example, below is the status of newbies that joined Steemit for various years. Let's create a Sparkline for each year in order to perform a quick analysis.
| Year | Jan | Feb | March | April | May | June |
|---|---|---|---|---|---|---|
| 2019 | 50 | 80 | 30 | 10 | 60 | 40 |
| 2020 | 36 | 10 | 70 | 50 | 55 | 44 |
| 2021 | 200 | 108 | 150 | 90 | 60 | 43 |
| 2022 | 100 | 60 | 85 | 46 | 20 | 15 |
Okay friend, after you have imputed the data above, follow the steps below an insert sparklines.
Step:1 Determine the Sparkline's types from the insert menu, choose the next column to be "June," then put Sparkline.
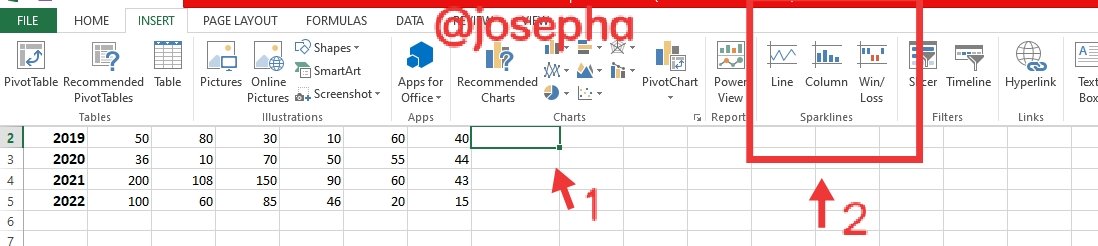
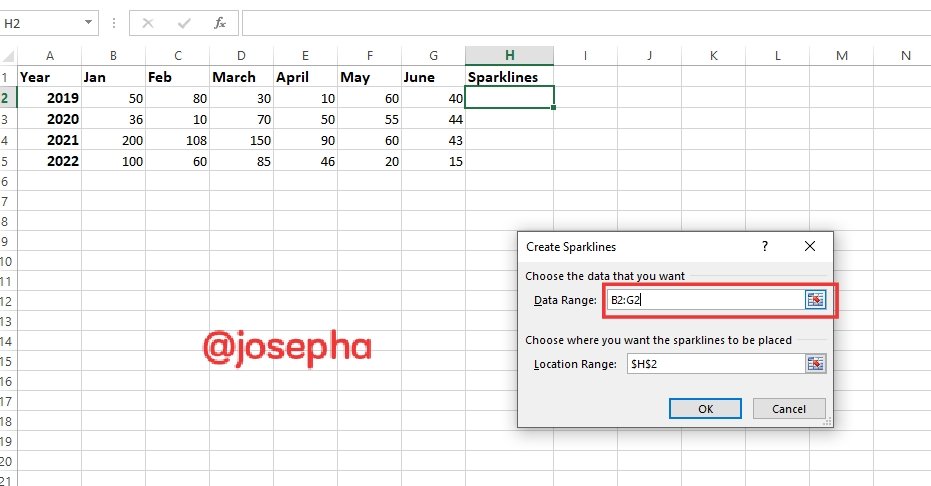
Step: 2 Select a set of cells. A selection window will display for you to choose the range of cells for which the Sparkline should insert.
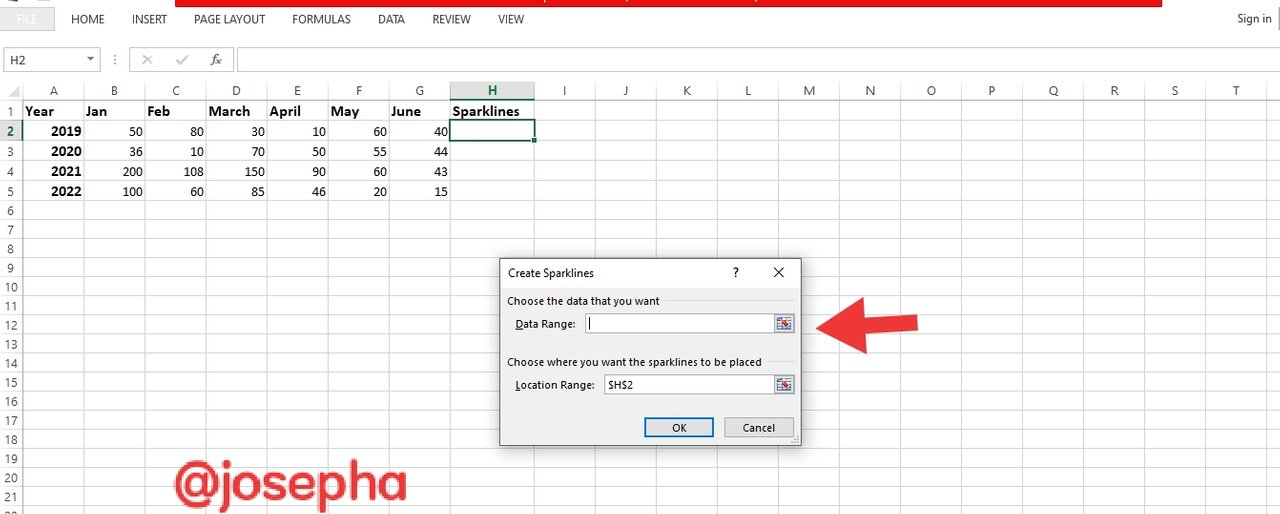
Note: The data range box's arrow can be clicked to select a range of cells.
Step: 3 Display of Selected Data Range In the text box labeled "Data Range," select the first row of data for the year 2019. The range is displayed as B2:G2.
Step:4 Select a Location Range Where you wish to insert the Sparkline.
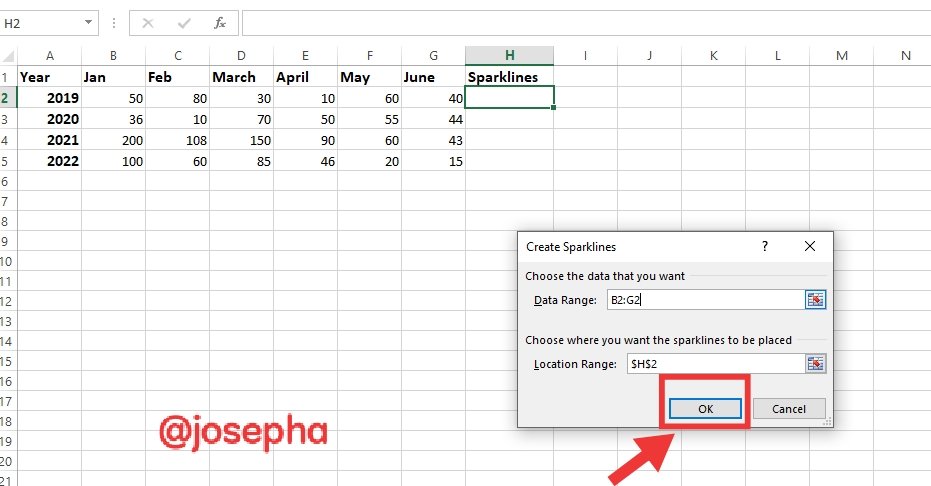
Step: 5 Click on your "OK" button. Press the "OK" button after setting the "Data Range" and "Location Range."
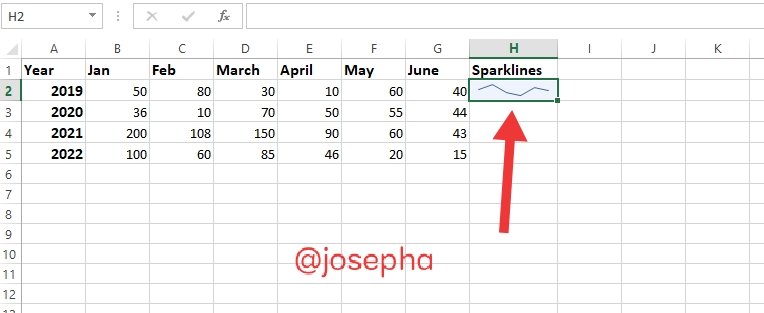
Step:6 The selected cell now contains a Sparkline. The Sparkline is now formed for the chosen data and placed in the chosen cell H3.
How you can format sparkling using Excel.
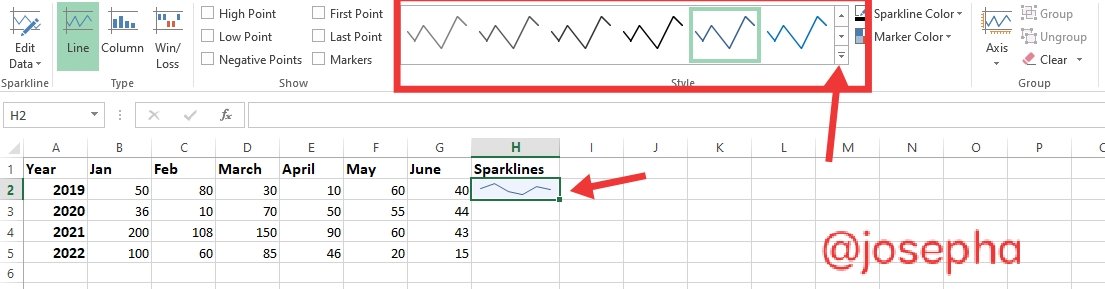
First, click on the newly produced Sparkline to format it. The menu bar will now include a new tab called "design" that contains the Sparkline tools and allows you to modify the color and style of the chart.
The next step is for you to examine each of the choices that are offered. You can adjust Sparkline's various features to suit your needs. The axis is one of them, as are style, color, thickness, and type.
How to change sparklinge style
Step 1: From the design menu's "Style" option, choose a style. the dropdown's styles selection.
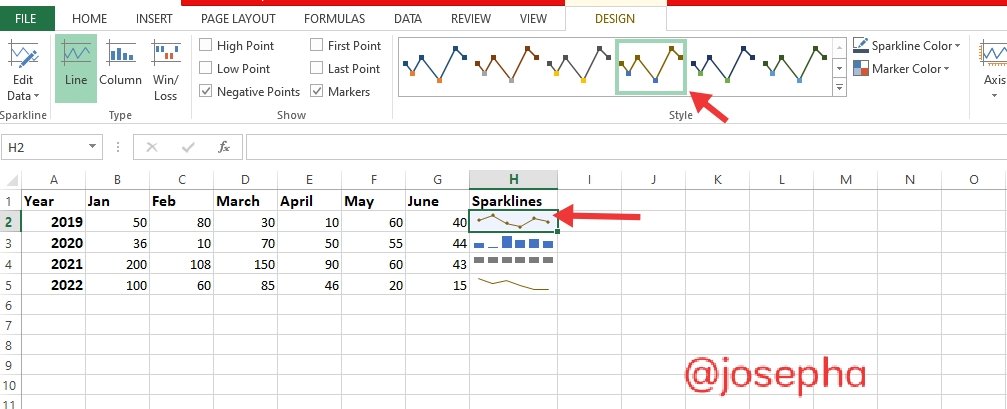
Step 2: To choose your preferred style from a vast design catalog, click on the down arrow next to the style selection.
How to change Sparklines' color
The Sparkline Color option allows you to modify the color and thickness of the sparkline. There are several colors that are available for you to choose.
Step:1 From the design menu, select the Sparkline and then the Sparkline Color option.
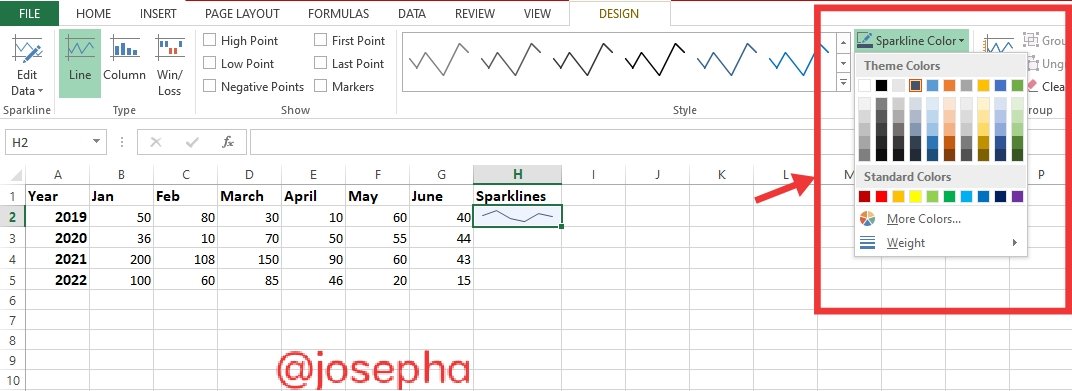
Step:2 Select the color you wish to modify by clicking. The chosen color will be updated on the Sparkline.
How to Highlight Sparklines data points
On a Sparkline, you may highlight the highest and lowest points as well as all of the data points. This will enable you to see the data trend more clearly. So let's get to see how we can do that.
Step:1 Pick the sparkline you just made in any cell, then go to the design menu. Various checkboxes are visible to emphasize the data points.
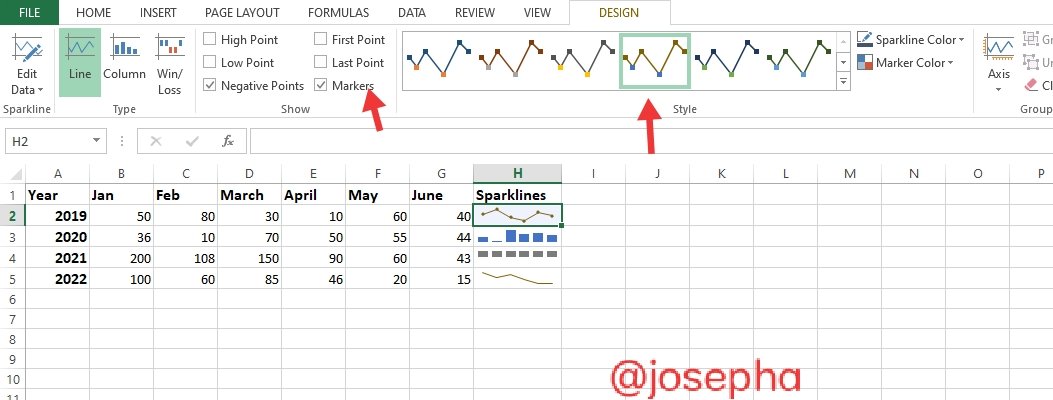
Step:2 Check the boxes next to the data points you want to emphasize. The choices are as follows:
Highlights: It stands for the high and low places on the Sparkline with the phrase
High/Low Point: This will make the first and last data points on the Sparkline stand out more. This is what you can us to draw attention to negative values.
Markers: This choice only applies to Sparklines with lines.
How to delete Sparklines
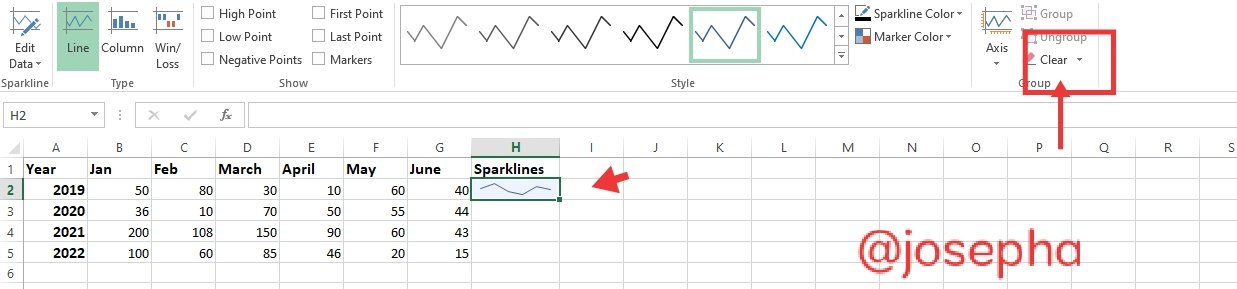
Step:1 Select the cell, which included the Sparkline.
Step:2 Go to Sparkline tools design menu.
Step: 3 Click on the clear option as shown in the screenshot and your sparklines will be deleted.
Importances of Sparklines in Excel
The following are the Importances of Sparkline in Excel
Sparklines help you to visualize your data, such as the current temperature or stock price.
Sparklines help in reducing data to a manageable size.
Sparklines are important as they analyze the historical data trends.
Following a change in cell width, Sparkline's size is automatically modified.
Okay, friend, we have come to the end of our tutorial. I am sure you now know what Sparklines in Excel are all about and how you can use them to modify your data. Thank you for stopping by.
| 20% Goes to @smilenigeria |
|---|
Comments