An Introduction to Balance of Power Indicator
3 comments
In the financial markets, technical analysis is what you cannot do without because you will need to know the direction of the market before jumping in. Two forces control the financial markets like crypto and forex with the help of the balance of power indicator you will be able to know the force that has the greatest power. Let's take a quick ride and know what the balance of power indicator means.
Balance of Power Indicator
As we have introduced, we stated that two forces control the crypto market and other financial markets. There is no other force than buyers and sellers forces which balance of power indicator is created for you to know the force that has the extreme power in the market.
Tradingview
Before we go further, note that Don Worden is the man who developed the balance of power indicator which you have seen in the screenshot image above. He developed this Indicator so that traders, investors, financial analysts, and everyone who has an interest in the financial markets will be able to know the ability of buyers and sellers before jumping into the market.
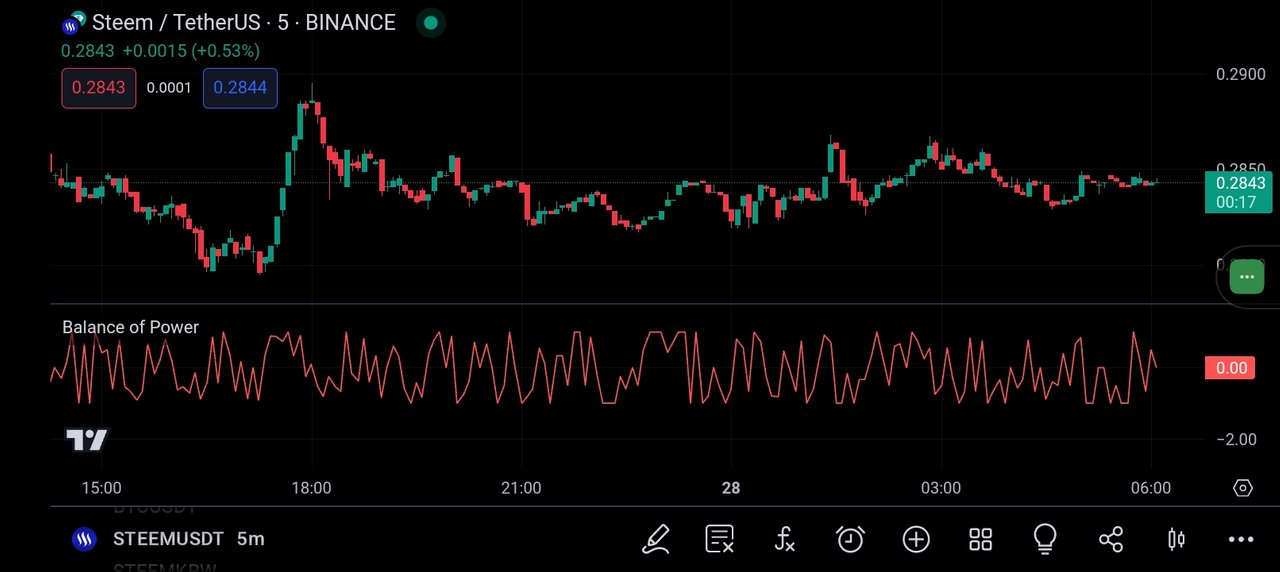
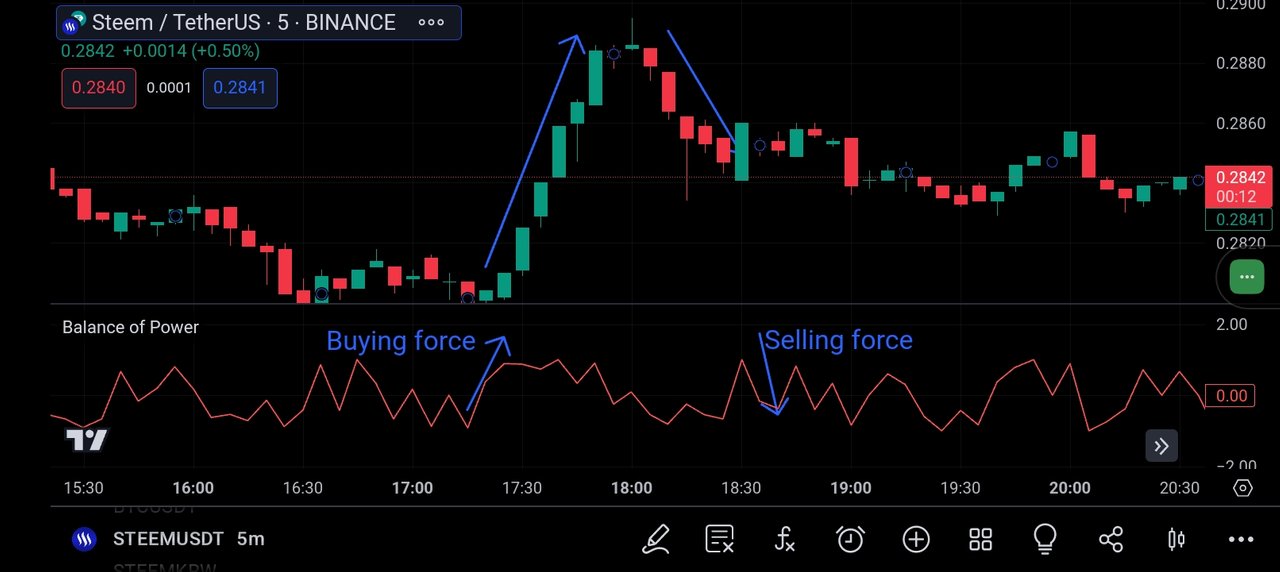
Simply put, Balance of Power is an indicator that helps you to measure price trends by determining the strength of buyer force and seller force, which assists you in knowing how strongly the price of the asset you are analyzing will move extremely higher or lower.
Tradingview
Balance of power oscillates between -100 and 100, in which the negative values are an indication of a powerful selling force, whereas the positive values are an indication of a powerful buying force.
Calculation
BOP is very easy to calculate and all you have to do is to get your high, low, open, and close price after getting it, you can then use this formula to calculate BOP.
BOP = SMA of [Open - Close) / (High - Low) ]
From the given above formula, it means you will first take your open price, of the asset and subtract (-) the close price of the asset.
As for the high and low, all you have to do is take the highest price of the asset and subtract (-) it from the lowest price of the asset.
Now, at this point, you have to divide the answer you get first, from your second answer. I.e divide whatever you get from subtracting open from close and divide it with what you get from subtracting high from low.
How you can add and configure BOP
It is very simple to add BOP on your chart and all you have to do is to insert BOP the same way you have been inserting other indicators. Let's use Tradingview for this illustration.
 Tradingview
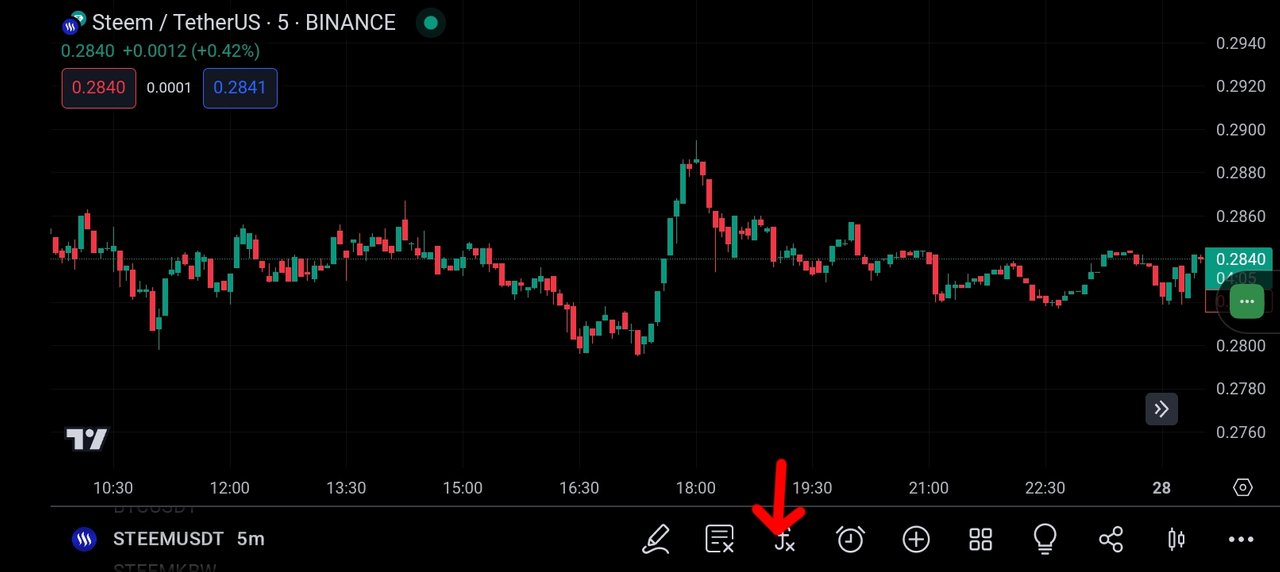
By using Tradingview, the first step you are to take instead of BOP is to open trading and launch a chart, then select the asset you want to analyze.
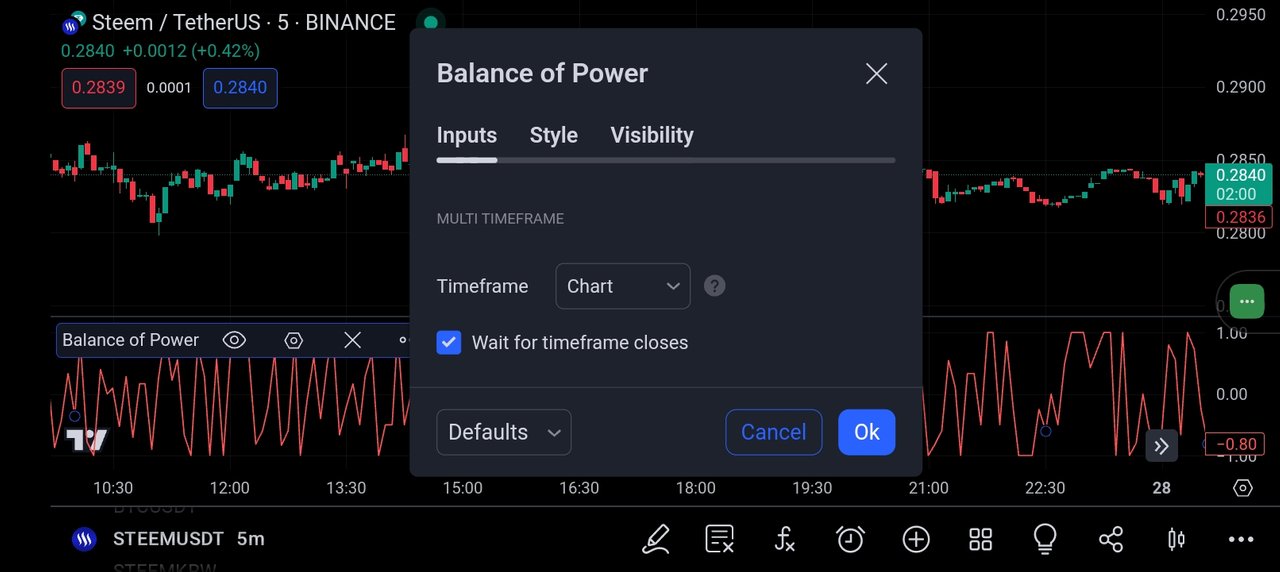
Tradingview
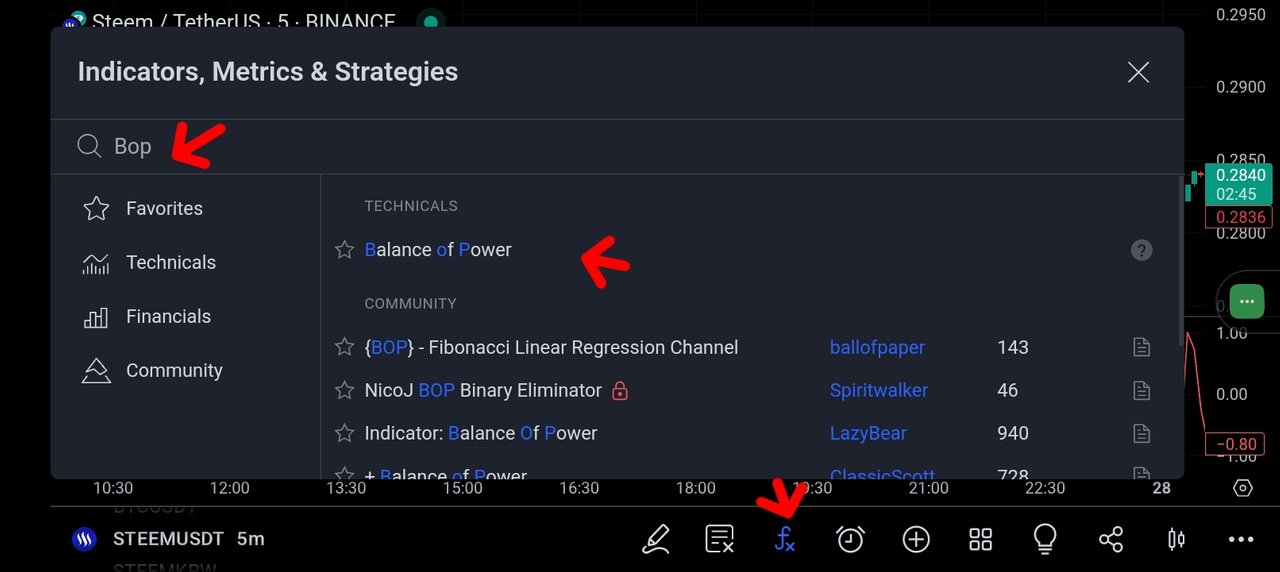
If you're using the Tradingview App, click on the function sign, and it will take you to the search box, which you can type in BOP and immediately select the indicator. Once selected, exit go back to your chart, and configure the indicator to your test by changing the colors and parameters.
Conclusion
Today, we have so far learned what the balance of power indicator means which is an indicator that is used to measure the power between the buying force and the selling force in the market. Note: This post is not investment advice, but educational content that is written to educate you about balance of power indicators.
Comments