Steemit Crypto Academy Season 5 [Advanced Course] Week 4 - Trading Crypto with On-Balance Volume Indicator
11 comments
Introduction
It's another great time to present another lecture for yet another week in the academy. Season 5 of the crypto academy has been running well since it started and a lot has been added to the participants. It's week 4 of the academy and I will be presenting a lecture on Trading Crypto with On-Balance Volume Indicator. Let's take a ride together.
Designed with Adobe Photoshop
Background to the Study
A few weeks ago, I discussed a topic on Aroon indicator which is a technical analysis tool that is used to determine trends and measure the strength of the trend. For this week, we would be looking at yet another technical analysis tool known as On-Balance Volume Indicator, this lecture will encompass a few things to know about the indicator, its usage, why it is important and so many other things to talk about this indicator.
In the crypto ecosystem and general world of assets' analysis, there is a great relationship between the volume of an asset traded at a period and the price of the asset. Basically, volume injected in either direction (buy/sell) has a significant impact on the price of the assets, how volume-up or volume-down affects the price of the asset in either trend (uptrend/downtrend), these are some of the things we are going to discuss in this context and how the tool On-Balance Volume Indicator can be utilized for proper analysis.
On-Balance Volume (OBV) Indicator
The credit of On-Balance Volume (OBV) can be traced to Joseph Granville who developed the first OBV in the year 1963, having it included in one of his stock market books. On-Balance Volume Indicator is a technical analysis tool that is a momentum indicator used to determine the direction of an asset's price as predicted from the volume injected in either sell/buy. In essence, the cumulative result of volume-up/volume-down of this indicator is used to predict the price of an asset in the soonest future which helps traders to have insight into the market of choice before making decisions.
Earlier in this context, I highlighted how volume injected into the market affects the price of an asset at any point in time, if the volume of purchase in a market is high, which is an indication of massive buy from traders, then there is an assurance that the price of the asset would be triggered, sending the asset uptrend.
In addition, if the volume of sale is huge which shows the pressure of selling off of the asset, it is assumed that the asset's price would experience a fall which sends the asset downtrend. The On-Balance Volume indicator helps traders to see how the pressure of buy or sell is taking place and prepare one to predict the next movement of the price of the asset in question.
Highlights of On-Balance Volume Indicator
- On-Balance Volume indicator measures the volume of buy/sell over time and work on a cumulative basis, adding the volume on up days and subtracting volume on low days.
- It helps traders to easily predict the price of an asset as deduced by the volume injected in either direction (buy/sell).
- On-Balance Volume indicator is used to identify breakouts in the market and possible divergences (bullish/bearish).
- OBV validates the market price movement of an asset with consecutive higher highs in an uptrend and lower lows in downtrend.
Setting Up OBV on Chart
In this section, I will be showing how to add the indicator on the crypto chart. The platform I will be using is https://www.tradingview.com/chart/. Let's see the simple steps below.
- Select fx from the landing page.
- Search OBV on the next interface and click to add. See the screenshots below.
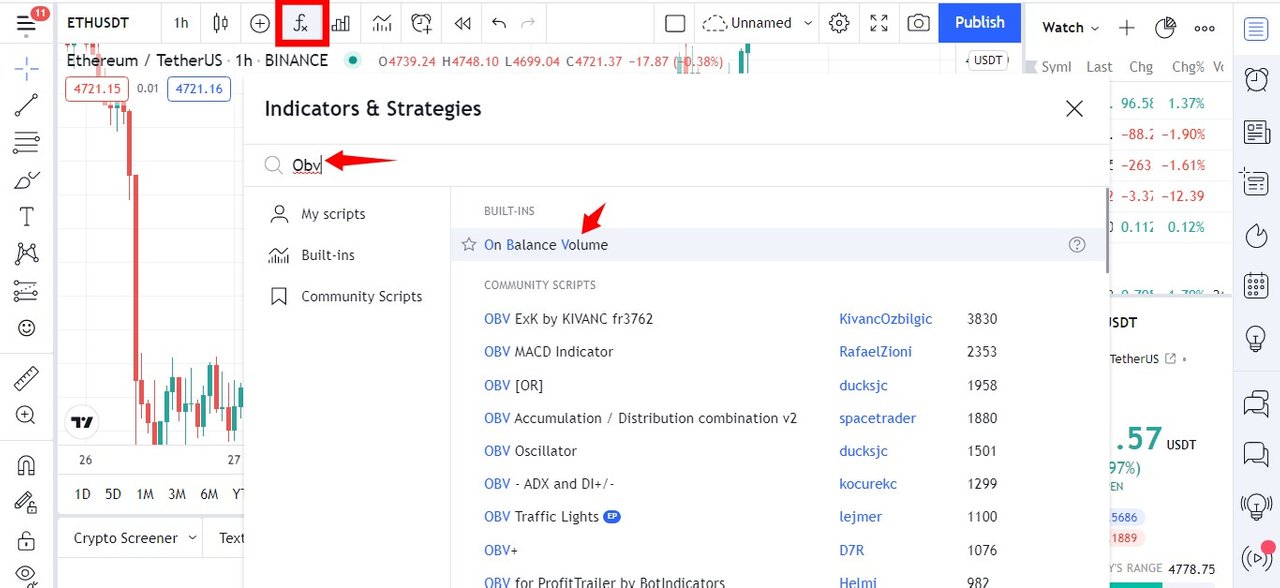
Select- fx | Search- OBV | Click to Add
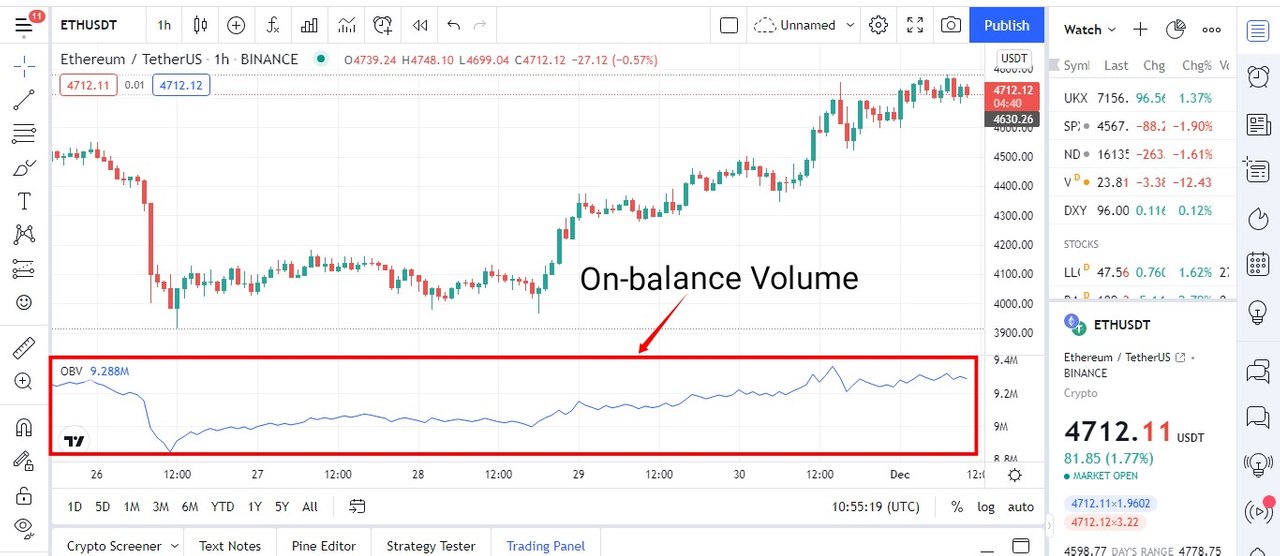
On-balance Volume Indicator added
From the screenshot above, I have just added OBV indicator and
the line oscillates according to the volume injected at a particular period.
Formulas and Rules for Calculating On-Balance Volume Indicator
To make the understanding of the formulas clearer, below are a few key terms that would be considered.
OBV = The present On-Balance Volume Level.
OBVprevious = The previous On-balance Volume Level.
Now,
- If the current price close is higher than the previous day's close, then, OBV = OBVprevious + Current Volume .
- If the current price close equals the previous day's close, then, OBV = OBVprevious + 0.
- If the current price is lower than the previous day's close, then, OBV = OBVprevious - Current Volume.
Trading with On-Balance Volume Indicator
The purpose of this lecture is to open the sight of crypto traders to the use of On-Balance Volume indicator for trading. As such we would be looking at a few things you should be on the lookout for when using this indicator. The ones to be considered in this lecture are;
- Trend Confirmation.
- Breakout Confirmation.
- Advanced Breakout.
- Bullish and Bearish Divergence.
We noted earlier that OBV line movement is a result of the volume injected into a market in either direction and it will move in the direction of the asset's price. OBV can be used for trend confirmation and in an uptrend, OBV can be seen to be making consecutive higher highs and higher lows, this confirms the uptrend, in fact, a strong one. Let's take the example below.
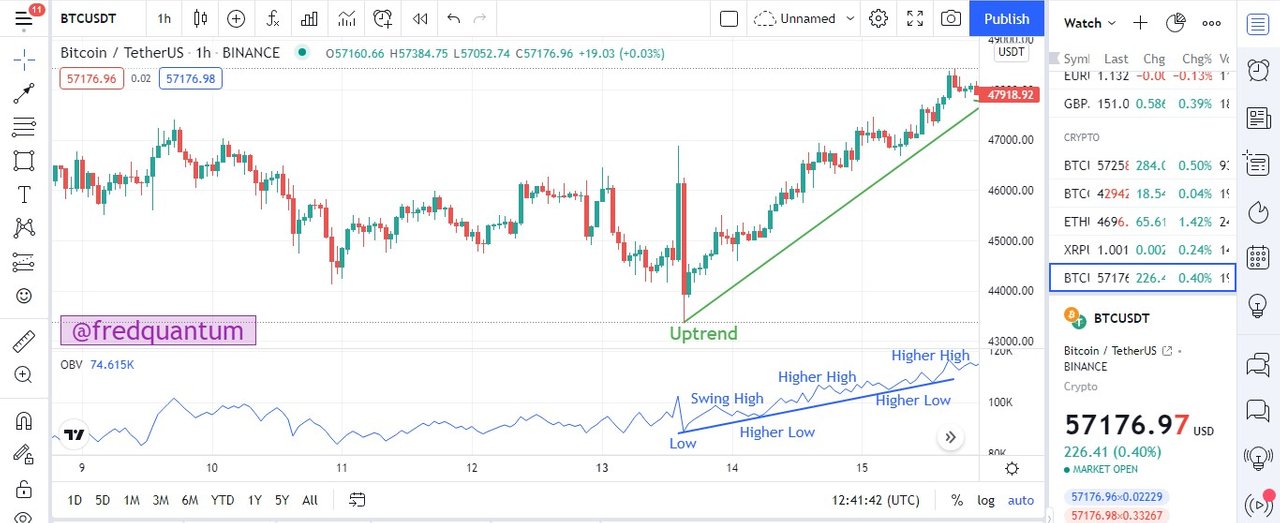
Uptrend Confirmation with OBV
From the chart above, the OBV line made a low and swing high. The movement was followed by a series of higher highs and higher lows which confirms an uptrend, some movement with the price of the asset. In that case, this type of movement would enable a trader to find a buy entry as the move is confirmed by the indicator.
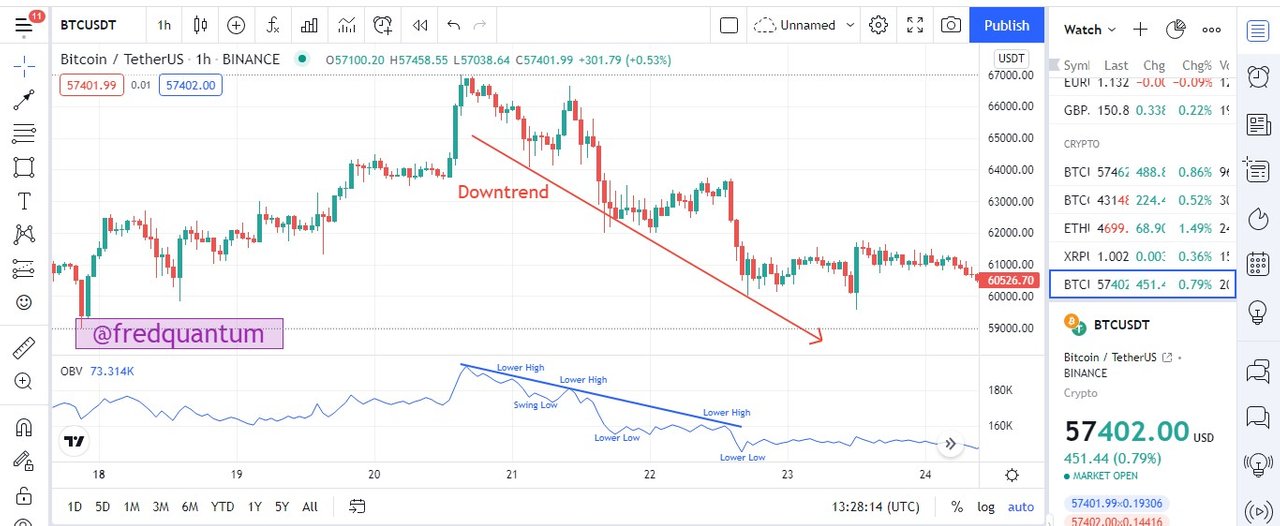
Downtrend Confirmation with OBV
Similarly, the chart above confirmed the downtrend movement of the chart. Looking closer at the chart, the price of the assets made some lower highs and lower lows, this same pattern was seen on OBV, and this confirms the validity of the downtrend. As such, traders would have positioned themselves for a sell entry to take something out of the market.
Breakout Confirmation with On-Balance Volume Indicator
On-Balance Volume indicator can also be utilized in range markets to confirm a breakout in either direction. In a consolidating market when the price bounds on resistance and supports for a while, which is an indication of a range market, when there is a breakout, OBV helps to confirm such a break as a result of the volume of trades that bring about the breakout. And this enables a trader to position himself/herself for an entry/exit. Let's take a look at a chart below.
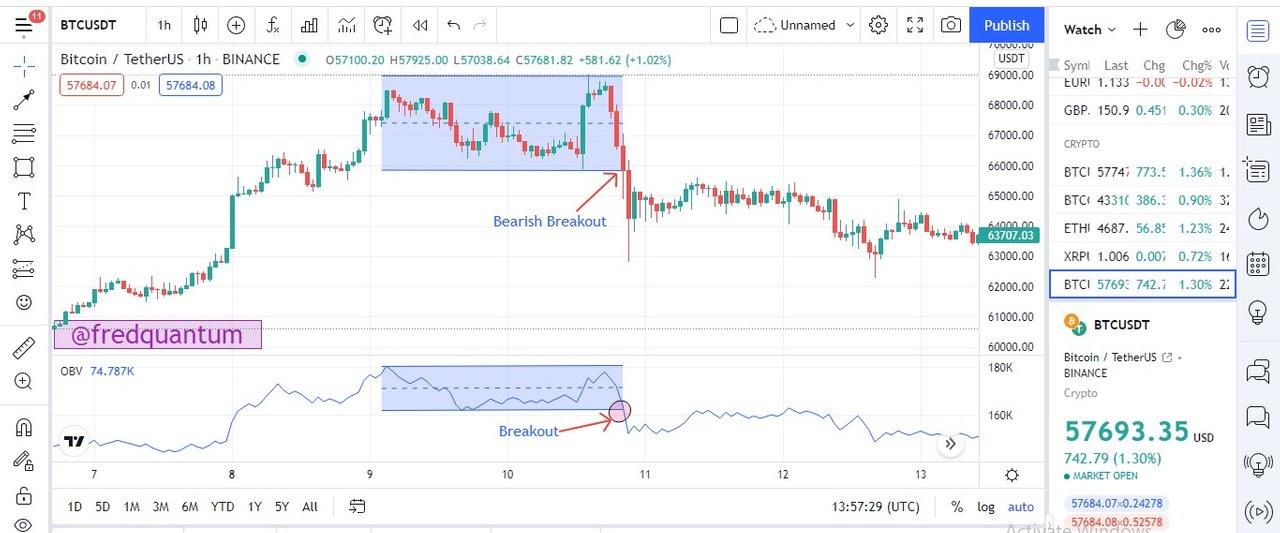
Breakout Confirmation with OBV
From the chart above, the market has been consolidating for some time as the price of the asset moves within certain resistances and supports, the same movement was seen on the OBV indicator which indicates that the price movement is being supported by volume. In the long run, the price of the asset broke the support below and the asset goes downtrend, this break was validated on the OBV and this confirms the authenticity of the breakout and this would enable traders to make a trade choice.
Advanced Breakout with On-Balance Volume Indicator
In the last section, we talked about breakout confirmation with OBV, now we would be talking about advanced breakout. This is a type of breakout that occurs when the price of an asset hasn't been able to break the previous high/low, conversely, the On-Balance Volume indicator breaks the previous high/low, such a move is regarded as advanced breakout which indicates that the volume injected towards a direction would take the price of the asset beyond the previous high/low.
Take for instance, in a range/bullish market, if the price of the asset has not been able to break the previous high but OBV breaks above the previous high, this is an indication that the market of the asset would go further uptrend and traders can make use of the advanced breakout to position themselves for a buy position. Let's see a chart below.
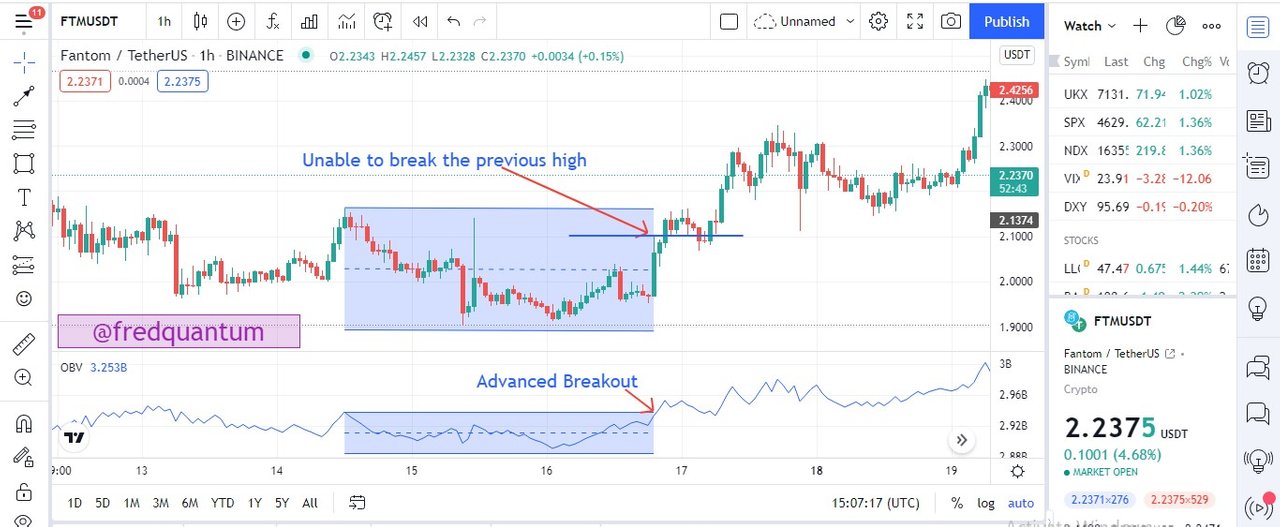
Advanced breakout with OBV
From the chart above, the previous high of the price of the asset was marked, likewise, OBV's previous high was at the same level. At a point, the OBV line broke above the previous high whereas the price of the asset was unable to break yet (that point was marked on the chart which was far below the previous price high), this is an advanced breakout which is an indication of more uptrend to come. Obviously, the market of the asset moved uptrend as the advanced breakout of OBV predicted.
Bullish and Bearish Divergence with On-Balance Volume Indicator
In a bullish market where the price of an asset makes consecutive higher highs but OBV indicates lower volume with its line making lower highs, this is an indication that the bullish run is almost over and a downtrend would follow and such an action is known as bearish divergence. This indication would prepare a trader to make a timely exit and prepare for an entry if he/she chooses to.
Likewise, in a bearish market associated with lower lows of the price of an asset, if the OBV indicator makes higher lows, this also signifies that the bear is almost over and a bullish trend is underway, this is known as bullish divergence. In essence, the divergence of the OBV indicator (bullish/bearish) is an indication of a probable trend reversal and this would prepare traders ahead to making investment decisions with the early signal. Let's take an example below.
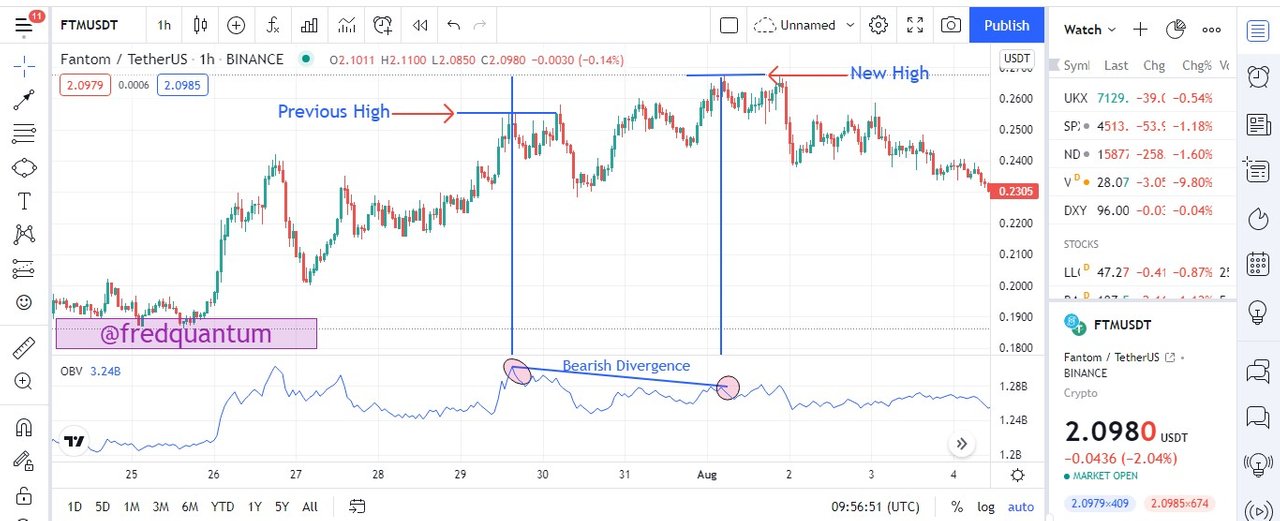
Bearish Divergence with OBV
From the chart above, a high on the price of the asset and On-Balance Volume indicator was marked, the price of the asset broke the previous high to create a few highs while the OBV indicator failed to break the previous high that was marked initially, rather a series of lower highs was seen, this is bearish divergence and a trader can use this indication to prepare ahead to enter the trade in the sell direction or even exit with proper trade management. In the chart example given above, you can see that the price of the asset broke the swing low that produced the new high and this validates the bearish divergence.
Conclusion
In conclusion, the On-Balance Volume indicator is one of the technical tools that is very easy to use and it's very potent in trades when used the right way, most especially, in a range market, it reveals the probable next movement of the price of an asset by measuring the volume injected into the market and this would prepare a trader ahead of the move.
Though this indicator is good, nevertheless, traders must be careful when using this indicator as bigger financial institutions can manipulate the market by injecting a large amount towards a direction to involve smaller traders and later injects in the opposite direction which affects the smaller traders. It is advised to combine another indicator for a more valid analysis. This is all for today and I hope you had a great read. Thank you.
Homework Task
- In your own words, explain your understanding of On-Balance Volume (OBV) Indicator.
- Using any charting platform of choice, add On-Balance Volume on the crypto chart. (Screenshots required).
- What are the Formulas and Rules for calculating On-Balance Indicator? Give an illustrative example.
- What is Trend Confirmation using On-Balance Volume Indicator? Show it on the crypto charts in both bullish and bearish directions. (Screenshots required).
- What's your understanding of Breakout Confirmation with On-Balance Volume Indicator? Show it on crypto charts, both bullish and bearish breakouts (Screenshots required).
- Explain Advanced Breakout with On-Balance Volume Indicator. Show it on crypto charts for both bullish and bearish. (Screenshots required).
- Explain Bullish Divergence and Bearish Divergence with On-Balance Volume Indicator. Show both on charts. (Screenshots required).
- Confirm a clear trend using the OBV indicator and combine another indicator of choice with it. Use the market structure to place at least two trades (one buy and one sell) through a demo account with proper trade management. (Screenshots required).
- What are the advantages and disadvantages of On-Balance Volume Indicator?
Comments