Moving Charts: TRX Value Per Coin Analysis | 10% To @tron-fan-club
8 comments
Hello and welcome to everyone at the Tron fan club. TRX has been performing great lately. This was another eventful week for TRX. This week TRX has both losses and gains, but mostly it's a comeback story. We have seen the token lose a substantial amount and regain all of it back. Today we look back at the price movements of TRX over the last few days.

Made with Canva.
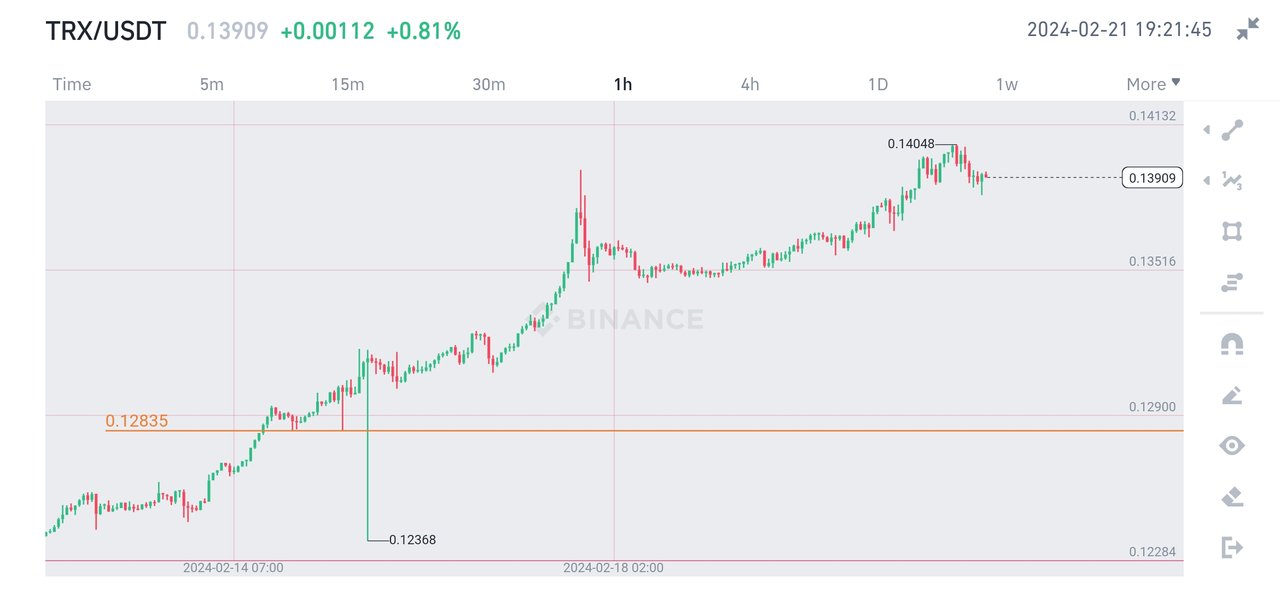
TRX was already on an uptrend for the past few weeks. In the past few months, TRX's price literally doubled. Although other cryptocurrencies faced a lot of hiccups in the road past few months, TRX was pretty much stable in its growth. This week's journey started under the 0.129$ level and soon it overcame this crucial resistance.
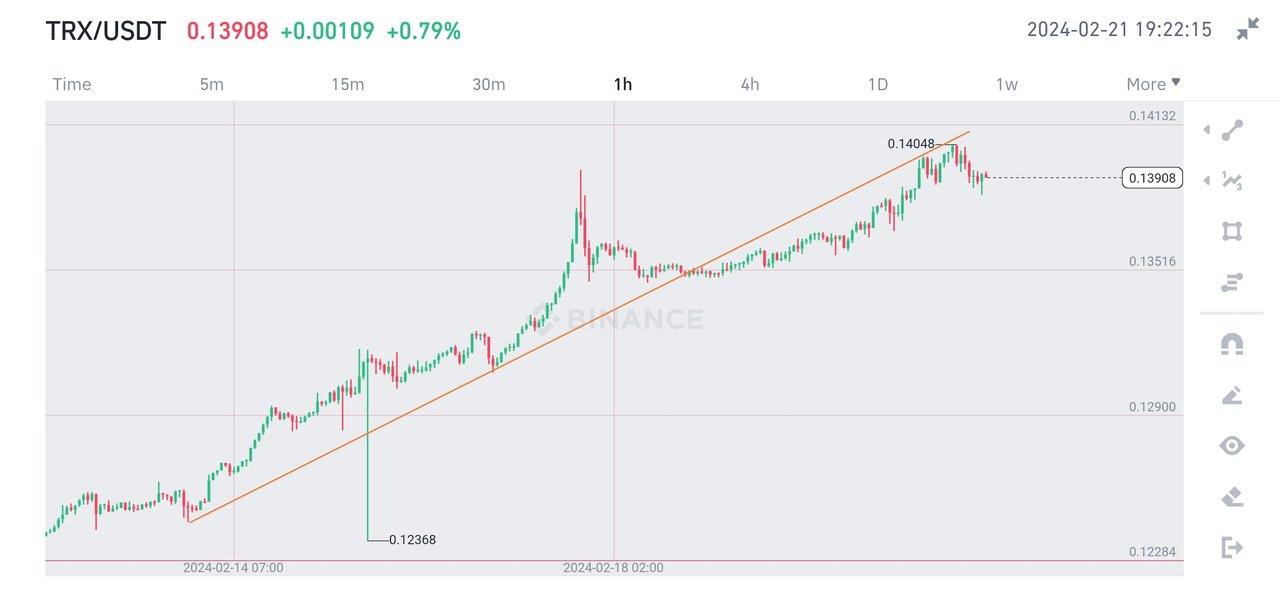
But then on the 15th of February, TRX suddenly crashed. But TRX has become pretty much strong and it was proved again. With a quick bounce, TRX came back to its previous value soon enough. With that move, a bullish trendline was also confirmed.
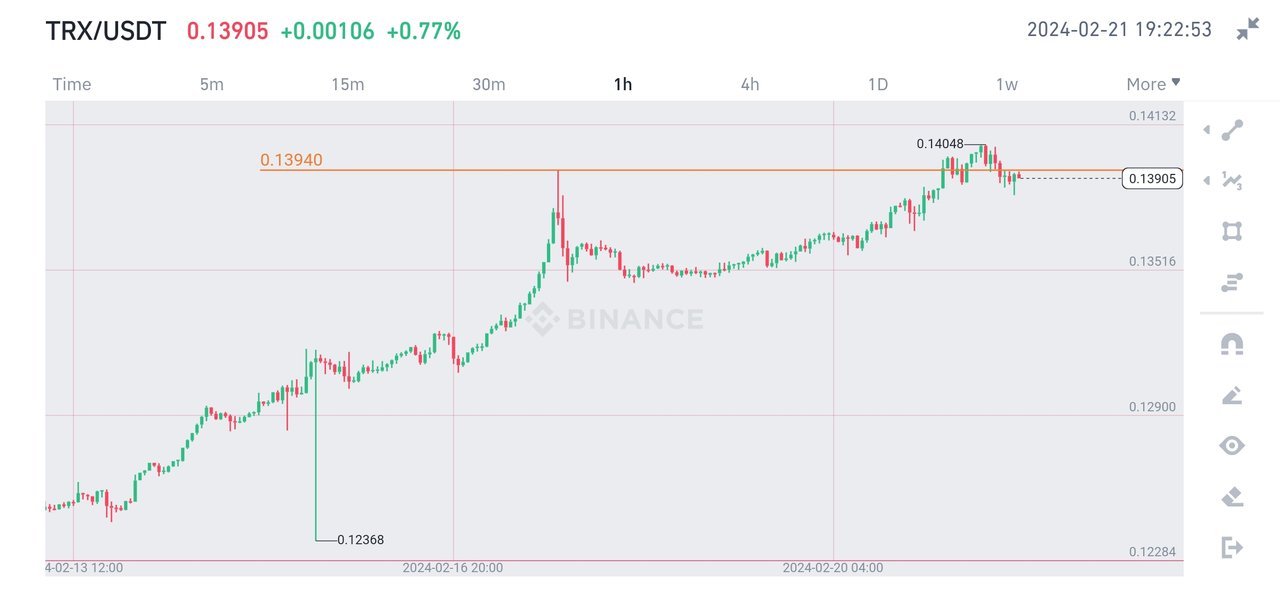
After the bounce, TRX started going upwards and continued the move. From 15th February TRX kept gaining value with the trend posting higher highs and higher lows until reaching 0.139$. After that, TRX fell a little bit and then again continued its upward journey. It is now hovering around the 0.139$ mark as of the time of writing this post. TRX needs to break though this level to make new highs.
All Screenshots are taken from Coingecko
No words from this article should be taken as financial advice.
VOTE @bangla.witness as witness

OR

Comments